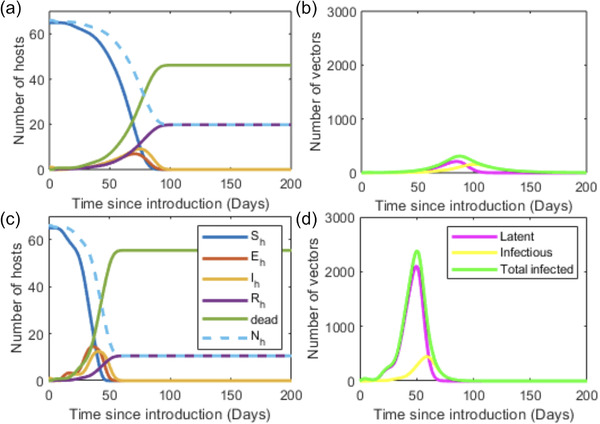
FIGURE 5.

Simulations of the Backer and Nodelijk (2011) model using the published (a, b) and updated (c, d) parameter values showing the outcomes for the host (a, c) and vector (b, d) populations over time after the introduction of infection into a population of 66 horses. These parameter values are given in Table 1 and Table S1
