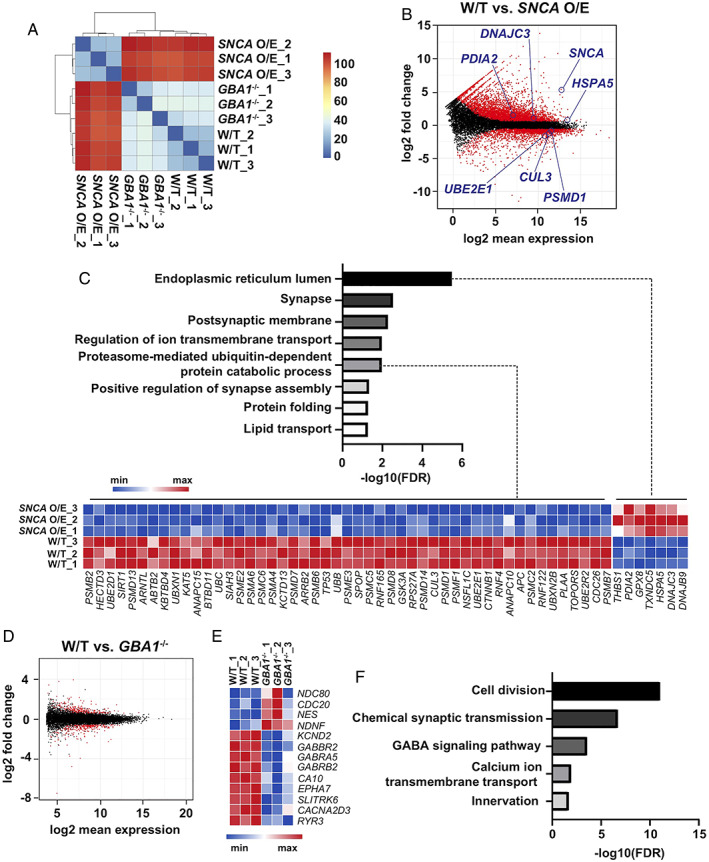
FIGURE 8.

Transcriptomic characterization of GBA1 −/− and SNCA overexpressing (O/E) human midbrain‐like organoids (hMLOs). (A) Clustering analysis of the RNA‐sequencing (RNA‐seq) data. The Euclidean distance of the normalized gene expression among wild‐type (W/T), GBA1 −/−, and SNCA O/E hMLOs was used for sample clustering. (B) MA plot showing the distinct genes differentially expressed in SNCA O/E hMLOs in the RNA‐seq data set. Statistically significant differentially expressed genes (DEGs; |fold change| ≥ 1.5, p‐adj ≤ 0.05) are highlighted in red (related to Table S1). (C) Gene Ontology (GO) enrichment analysis of DEGs dysregulated in SNCA O/E hMLOs. A heatmap representation of the DEGs (|fold change| ≥ 1.5, p‐adj ≤ 0.05) known to be associated with protein catabolism and endoplasmic reticulum stress is shown in the bottom panel (related to Table S1). (D) MA plot showing the DEGs in GBA1 −/− hMLOs. Statistically significant DEGs (|fold change| ≥ 1.5, p‐adj ≤ 0.05) are highlighted in red (related to Table S1). (E) Heatmap representation of selected DEGs between W/T and GBA1 −/− hMLOs (related to Table S1). (F) GO enrichment analysis of selected DEGs in GBA1 −/− hMLOs (select GO terms are ranked by the adjusted p values; related to Table S2). FDR = false discovery rate; GABA =γ‐aminobutyric acid. [Color figure can be viewed at www.annalsofneurology.org]
