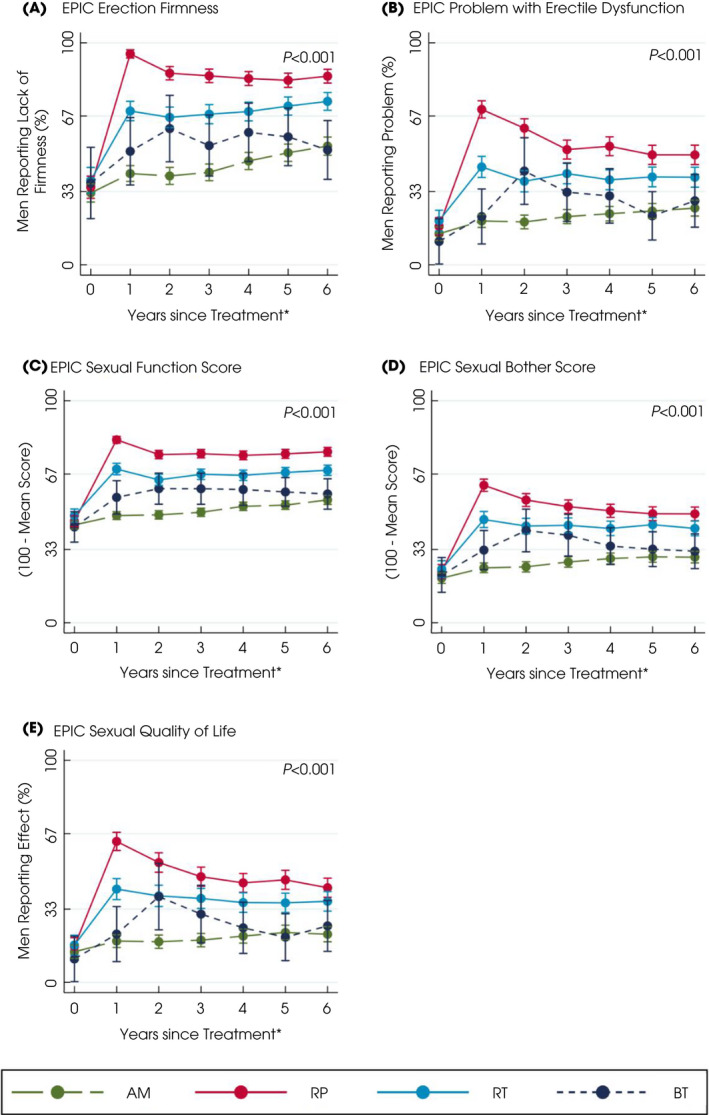
Fig. 2.

Patient‐reported sexual symptoms and QoL after primary treatments for localised prostate cancer over 6 years. *Questionnaires completed for e.g., year 2 as between 1 and 2 years after treatment. Higher scores or percentages indicate worse symptoms. Points are estimated means from models with error bars representing 95% CIs. P value based on likelihood‐ratio test for overall comparison of treatments. [Colour figure can be viewed at wileyonlinelibrary.com]
