
FIGURE 2.
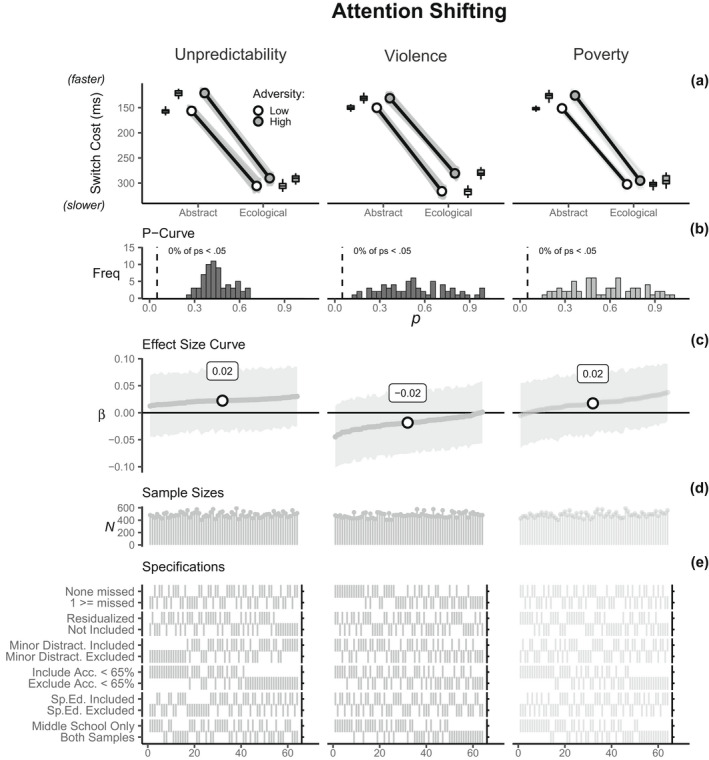
Visualization of multiverse attention‐shifting results. Unpredictability and violence exposure multiverse analyses were confirmatory and poverty analyses were exploratory. (a) visualizes the multiverse task version × adversity interaction on abstract and ecological task versions across high (+1 SD) and low (−1 SD) adversity exposure (y‐axis was reversed so that higher values = faster shifting), (b) plots p‐curves associated with each interaction term, (c) plots sorted interaction β‐coefficients across each arbitrary decision, (d) plots the sample sizes for each effect, and (e) is a specification grid indicating the data processing decisions associated with each effect