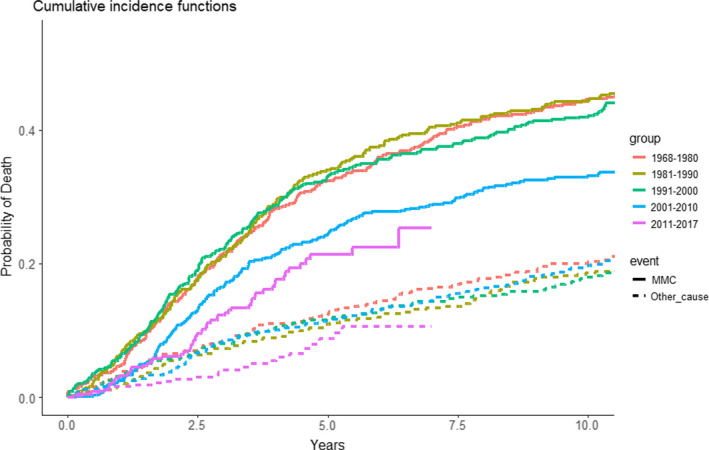
Fig. 7.

Cumulative incidence functions of disease specific mortality with death from other causes as a competing event, Fine and Grey model. Curves are shown as disease specific survival by year of diagnosis in the following periods: 1968–1980, 1981–1990, 1991–2000, 2001–2010 and 2011–2017. The solid lines represents death due to MMC and the dotted lines represents death due to other causes.
