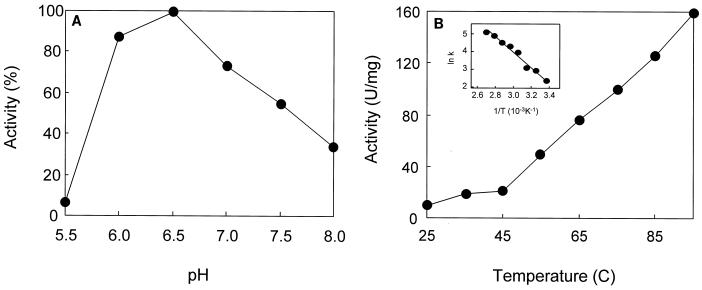
FIG. 3.
Determination of the pH (A) and temperature (B) optima of the P. aerophilum nitrate reductase. The inset in panel B shows the Arrhenius plot, which was calculated using the data from panel B. The symbol k is the rate constant for nitrate reduction, and T is the temperature. The activity was determined as described in Materials and Methods.

