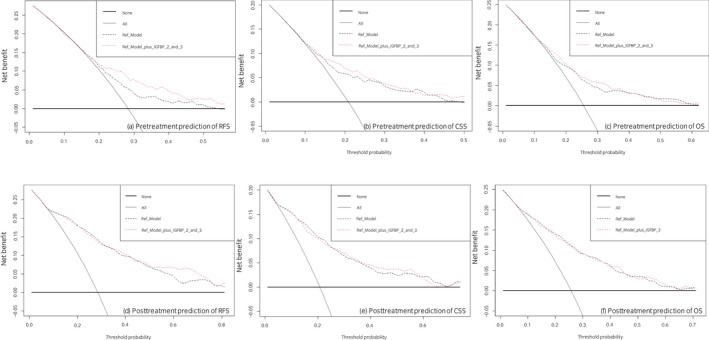
Fig. 3.

DCA for the additional net benefit of IGFBP‐2 and ‐3 based on a preoperative reference model (upper row: including age, sex, and clinical tumor stage) and a postoperative reference model (lower row: including age, sex, adjuvant chemotherapy, positive surgical margins, pT status, pN status and concomitant CIS on final pathology report) for the prediction of RFS (a + d), CSS (b + e), or OS (c + f) in 1036 patients treated with RC for UC of the bladder. Description: the x‐axis is the threshold probabilities. The y‐axis measures the net benefit which is calculated by adding the true positives and subtracting the false‐positives. The horizontal line representing the x‐axis assumes that no patients experiences recurrence whereas the grey line assumes that all patients will experience recurrence at a specific threshold probability. The dashed black line represents the net‐benefit of a basic Cox regression model which was fitted using above mentioned variables. The dashed red line represents the net‐benefit of the same Cox regression models which also include the preoperative NLR as a variable. [Colour figure can be viewed at wileyonlinelibrary.com]
