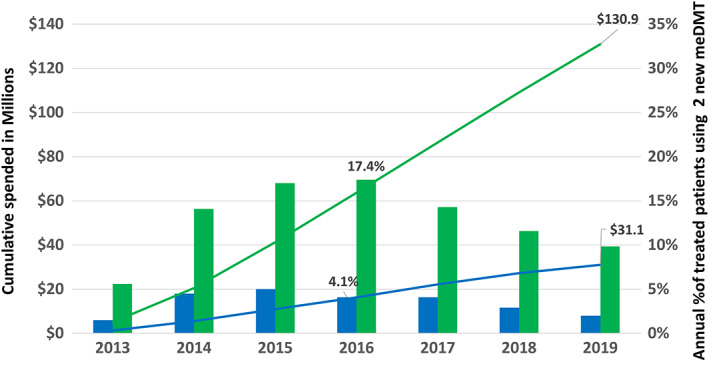
FIGURE 4.

Expenditures and uptake of new, low‐value, modestly effective disease‐modifying treatments (meDMTs). Depicted are the differences in the cumulative expenditures (in millions, US dollars, left vertical axis) on 2 low‐value oral DMTs (lines) and annual percentage of DMT‐treated patient‐years on either of these DMTs (bars, right vertical axis) in the MS Treatment Optimization Program–intervention region (Kaiser Permanente Southern California [KPSC]; blue) and the comparator region (green). This figure shows that the active counterlaunch campaign conducted in KPSC but not the comparator region significantly reduced uptake of these new, low‐value products (teriflunomide and dimethyl fumarate), leading to $99.8 million US dollars less in spending in KPSC than the comparator through 2019. Teriflunomide was US Food and Drug Administration approved in September 2012 and dimethyl fumarate in March 2013. The drug costs are the same for KPSC and the comparator region.
