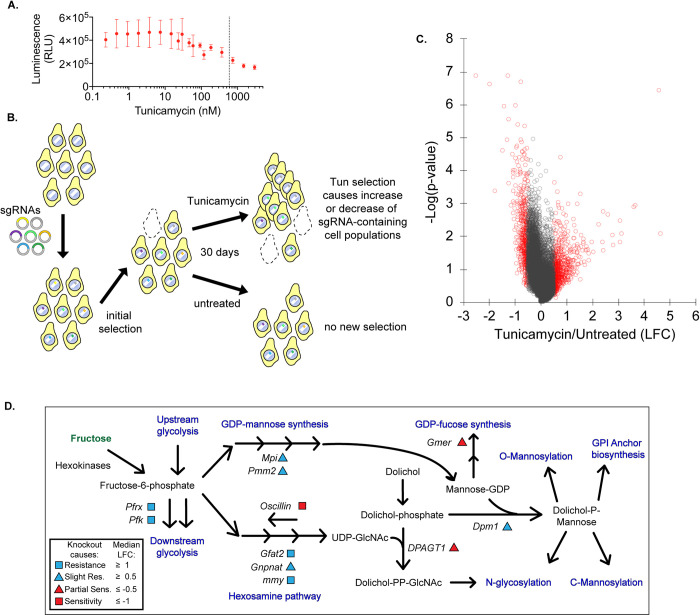
Fig 1. A survival screen reveals hexosamine, glycolysis, and GDP-mannose synthesis in resistance to DPAGT1 loss.
(A) We used a cell titer assay to determine the concentration of Tun capable of reducing cell growth rate by ~50% for use in both follow-up screens. (B) We introduced a whole genome guide RNA library into Drosophila cells stably expressing constitutive Cas9. Pooled cell populations were grown for 30 days either untreated or with Tun. Final cell populations were sequenced for sgRNA abundance to determine candidate genes implicated in Tun resistance or sensitivity. (C) Volcano plot of survival screen. Red dots indicate genes with an absolute lfc value of ≥0.5 or ≤-0.5. (D) A simplified model of one set of highly enriched pathways for gene knockouts causing resistance or sensitivity. Note that only genes whose knockout provided resistance or sensitivity are labeled.

