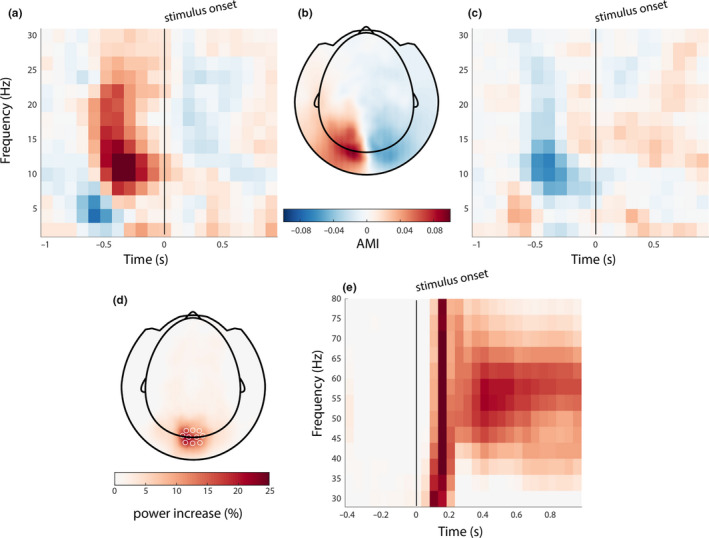
FIGURE 3.

Stimulus induced changes. (a, c) Spatial cue (presented at −0.8 ms) induced attentional modulation in posterior alpha power, as indicated by the attentional modulation index (AMI). The AMI over frequency and time was averaged over selected left and right posterior magnetoencephalographic (MEG) sensors, respectively. (b) The topography of the AMI in the alpha band, in the pre‐stimulus onset window. (d) The topography of the stimulus‐induced gamma response; (e) the time‐frequency response, averaged over selected occipital MEG channels
