
FIGURE 7.
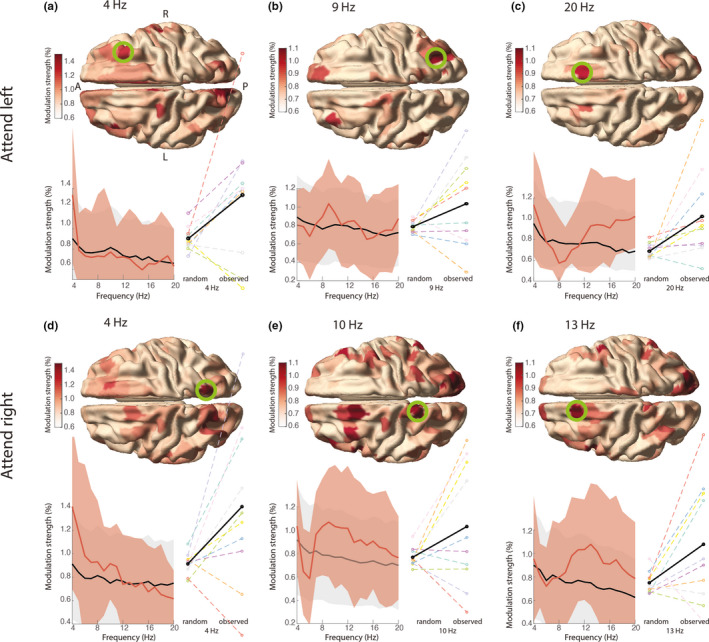
Phasic modulation of decoding performance in the frontoparietal network. The phasic modulation in attend‐left trials (a–c), and in attend‐right trials (d–f) is shown for all parcels, but only the parcels in the ROIs were tested statistically (see Figure 2) as described in Section 2.4.2. In a the anterior (A) to posterior (P) axis and left (L) and right (R) hemispheres are denoted. Spectrograms show the group‐average modulation strength in the selected parcel in the green circle (red) and the average expected by chance (black). Shading reflects SD across subjects. Individual effect sizes at the spectral peak are shown on the right of the spectrogram, with the group‐average in black