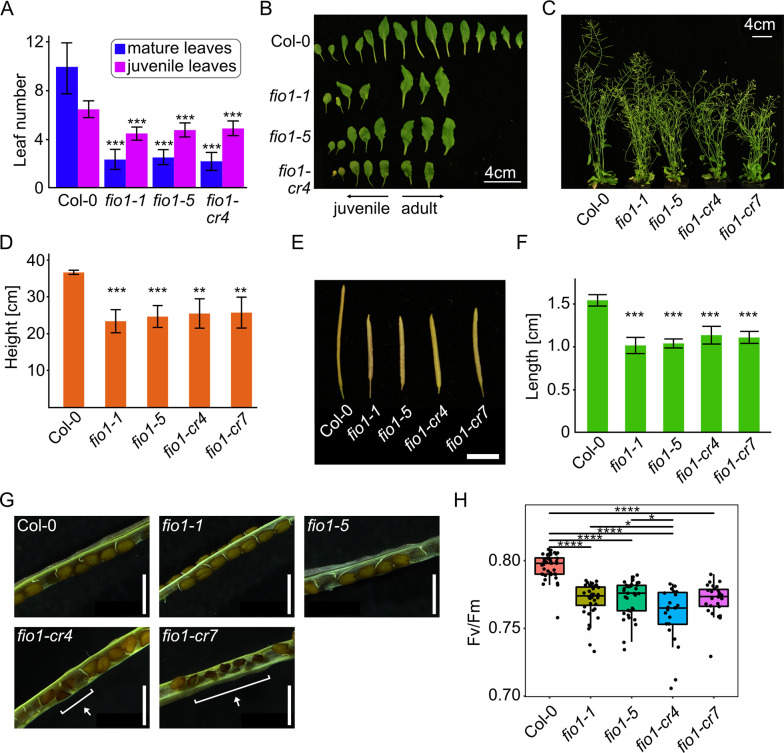
Fig 3. fio1 mutants display a pleiotropic phenotype.
(A) Number of mature and juvenile leaves of plants grown under LD at the bolting stage. Plotted are the means with bars denoting +/- SD with N = 11–17. Asterisks represent significance level between values determined by two-sample T-Test. (B) Rosette leaf morphology of representative WT and fio1 mutants at the WT bolting stage. (C) Branching phenotype of 44-day old WT and fio1 mutant plants grown in LD. (D) Height of tallest inflorescence of WT and fio1 mutant plants at senescence. Plotted are the means with bars denoting +/- SD with N = 3–6. Asterisks represent significance level between values determined by two-sample T-Test. (E) Silique morphology at maturation. One representative silique from each line. Scale bar is 5 mm. (F) Silique length at maturation. Plotted are the means with bars denoting +/- SD with N = 10–12 and 3 biological replicates of the WT and 4 biological replicates per fio1 mutant line. Asterisks represent significance level between values determined by two-sample T-Test. (G) Opened siliques from WT and fio1 mutants. Highlighted are aborted seeds of fio1-cr4 and fio1-cr7. Scale bar is 1 mm. (H) Photosynthetic efficiency of WT and fio1 mutant seedlings expressed as variable fluorescence/maximum fluorescence (Fv/Fm), N = 23–41. Asterisks represent significance level between values determined by two-sample T-Test. For all plots, *P ≤ 0.05, **P ≤ 0.01, ***P ≤ 0.001, ****P ≤ 0.0001.

