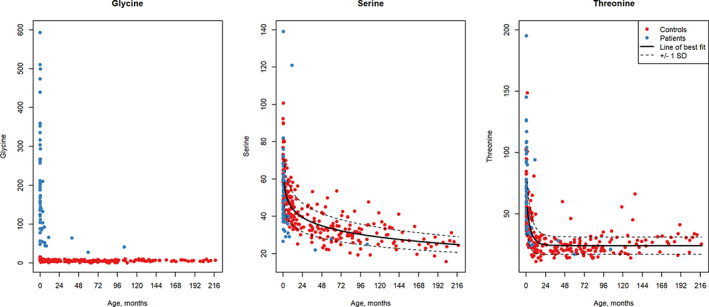
FIGURE 2.

Modeling of CSF serine and threonine values in normal controls. Values of CSF glycine (A), CSF serine (B), and CSF threonine (C) are shown in relation to age in months with controls in red and nonketotic hyperglycinemia patients shown in blue. The line of best fit developed by modeling control data is provided and the 1 SD curve in a dotted line. The CSF serine values of patients are in the lower half of the control values (except for two patients), and the CSF threonine tend to cluster above the average particularly during early months. CSF, cerebrospinal fluid
