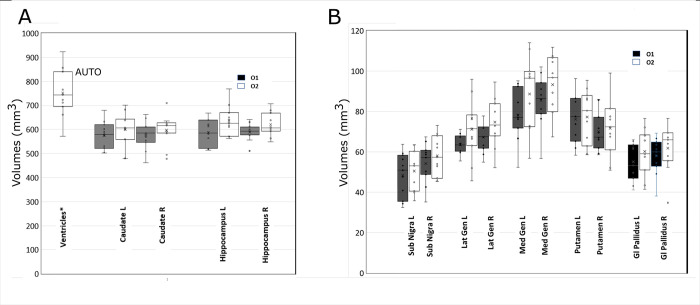
Fig 3. Data distribution of the segmented structures.
Whisker plot for the distribution of the segmented volumes from the two operators O1 (black) and O2 (white). A) The set Ventricles, Caudate, and Hippocampus. Ventricles have been automatically segmented. No statistical differences have been observed. B) The set Substantia Nigra, Lateral and Medial Geniculate, Putamen and Globus Pallidus. In this set, no statistical difference was observed.

