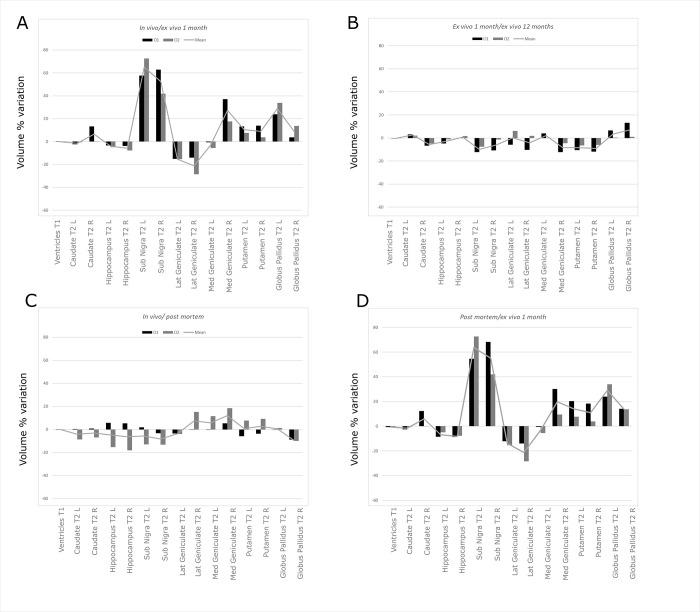
Fig 5. Longitudinal variations.
The results for the ventricles refer to the automatic segmentation. A) Volume variation between the in vivo and post mortem phases. Volume variations were obtained for O1 (black), O2 (gray), and the mean trend (line). It can be observed that the volume variation is always lower than 20%. The trend is variable between the two operators. This aspect may be justified by the difficulty of clearly distinguishing the exact borders of the structures in-vivo. B) Volume variation between the post mortem and ex_vivo_1 (after 1 month) phases. Volume variations were obtained on each structure for O1 (black), O2 (gray), and the mean trend (line). It can be noted that the agreement between the two operators is higher than in the previous phase, with most structures experiencing an increase in volume from the post mortem to ex vivo phase. This is particularly interesting since the shift of the contrast after the time in formalin qualitatively seems to improve the visualization of the smallest structures. C) Volume variation between the in vivo and ex_vivo_1 phases. It can be noted that also in this case the operators agree and a trend similar to the previous figure is observed across the structures, i.e. most of the smallest structures appeared more clearly identifiable, thus justifying an increase in the volume. D) Volume variation between the ex_vivo_1 and ex_vivo_12 phases. It can be easily observed that the volume variation is relatively low between the two phases, with an overall agreement from both operators, thus suggesting that the time spent in formalin does not significantly influence the volume variation.

