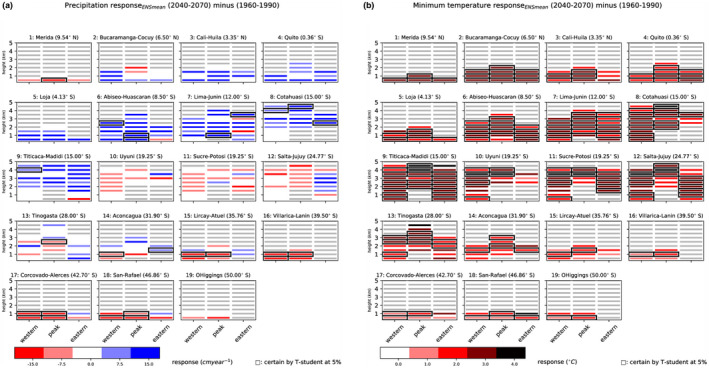
FIGURE 3.

Future projections of precipitation and minimum annual temperature in 19 locations along the Andes indicated in Figure 1a for 2040–2070 RCP8.5. (a) total annual precipitation and (b) annual mean near‐surface air temperature for each location split by 500 m elevation intervals (y‐axis) and aspect (W = western, pk = peak, E = eastern in the x‐axis). The changes are calculated using an ensemble of CMIP5 GCMs, as differences between the future (2040–2070, RCP8.5 scenario) and near‐present conditions (1960–1990). Black edge lines highlight confident changes (SNR at 95%), while grey cells are combinations of elevation and aspect without data. Latitude values represent the geographical coordinates of the top left corner of the bounding box defining each location (see Table S4)
