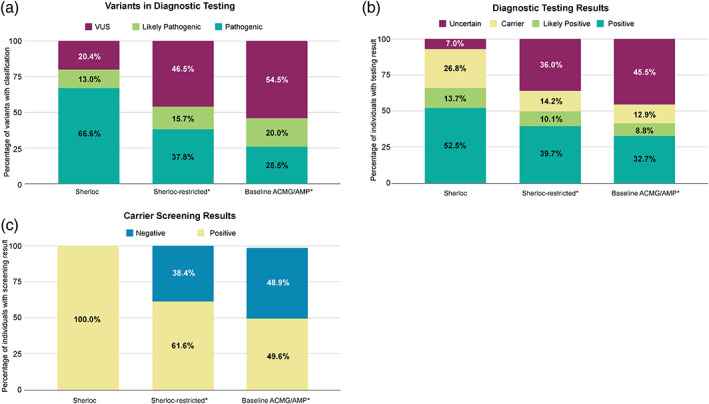
FIGURE 3.

Impact of differentially weighted phenotype evidence on variant interpretation and patient results. (a) Percentage of variants observed in diagnostic testing classified as VUS and P/LP among 1505 variants interpreted under three frameworks: (1) Sherloc, which includes both highly predictive and moderately predictive phenotype evidence, (2) Sherloc with all predictive phenotype evidence weighted as moderately predictive (“Sherloc‐restricted”), and (3) baseline ACMG/AMP criteria. (b) Percentage of 3979 individuals with specific diagnostic testing results based on variants interpreted within the three frameworks. (c) Percentage of 2917 individuals with a positive carrier screening result involving a variant previously interpreted with highly predictive phenotype evidence in Sherloc, compared to carrier screenings results under Sherloc‐restricted and baseline ACMG/AMP. Asterisks indicate that the variant classifications and patient results shown are based on simulated variant interpretations
