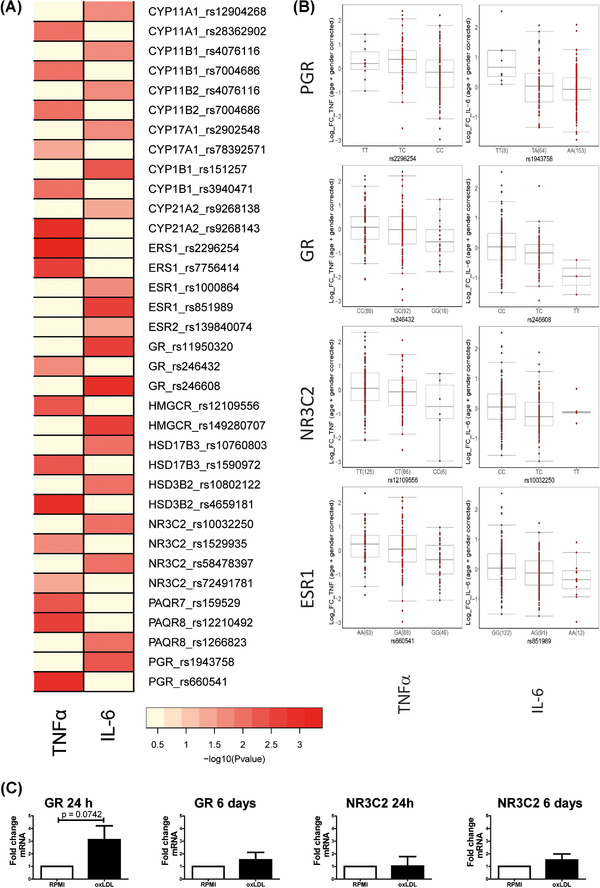
FIGURE 3.

SNPs around the steroidogenesis genes correlate with cytokine production after ex vivo training with oxLDL. (A) Heatmap highlighting SNPs in the steroidogenesis pathways that correlate with levels of TNFα and IL‐6 following ex vivo training with oxLDL (10 μg/ml) and restimulation with LPS (10 ng/ml). The color legend for the heatmap indicates the range of p values from QTL mapping. (B) Boxplots showing the genotype‐stratified cytokine levels for the most strongly correlated SNPS in the PGR, GR, NR3C2, and ESR loci for TNFα and IL‐6, respectively (n = 215 healthy volunteers for TNFα, n = 228 healthy volunteers for IL‐6)
