
FIGURE 9.
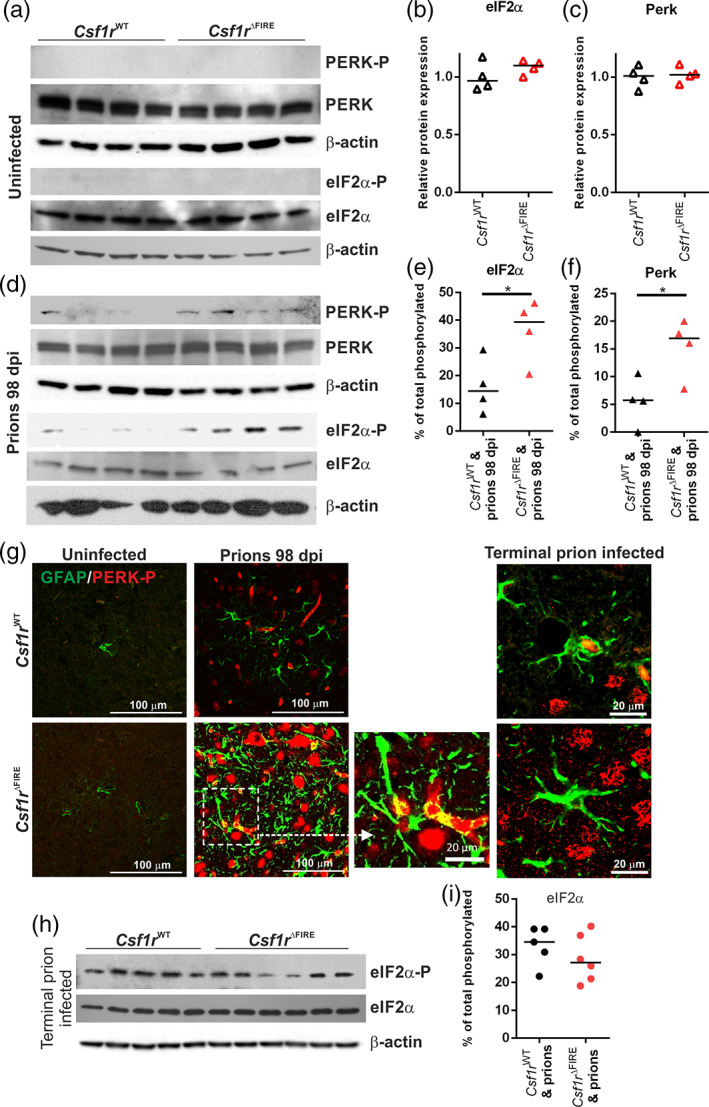
Increased unfolded protein response pathway is associated with earlier astrocyte activation. (a) Western blot analyses of age‐matched uninfected Csf1r WT and Cs1fr ΔFIRE mouse brains for unfolded protein response components as indicated, β‐Actin displayed as a loading control. (b) Quantitation of relative expression levels of eIF2α in uninfected Csf1r WT and Cs1fr ΔFIRE mouse brains. Not significantly different, Student's t‐test. (c) Quantitation of relative expression levels of PERK uninfected Csf1r WT and Cs1fr ΔFIRE mouse brain. Not significantly different, Student's t‐test. (d) Western blot analysis of 98 dpi prion‐infected Csf1r WT and Cs1fr ΔFIRE mouse brain for unfolded protein response components as indicated. (e) Quantitation of the percentage of total phosphorylated eIF2α in 98 dpi prion‐infected Csf1r WT and Cs1fr ΔFIRE mouse brain. *P < .05, Student's t‐test. (f) Quantitation of the percentage of total phosphorylated PERK in 98 dpi prion‐infected Csf1r WT and Cs1fr ΔFIRE mouse brain. *P < .05, Student's t‐test. (g) Immunohistochemical analysis of phosphorylated PERK (PERK‐P; red) and GFAP (green) in 98 dpi prion infected, terminal prion infected and age‐matched uninfected Csf1r WT and Cs1fr ΔFIRE superior colliculus (G3). Scale bars = 100 μm or 20 μm as indicated. (h) Western blot analysis of terminal prion‐infected brain homogenates probed for unfolded protein response components as indicated, β‐Actin displayed as a loading control. (i) Quantitation of the percentage of total phosphorylated eIF2α in terminal prion‐infected Csf1r WT and Cs1fr ΔFIRE mouse brains. Not significantly different, Student's t‐test. Points show individual mice. Panels A‐G, N = 4 mice/group. Horizontal bar = median. Panels H&I, N = 5–6 mice/group