FIGURE 1.

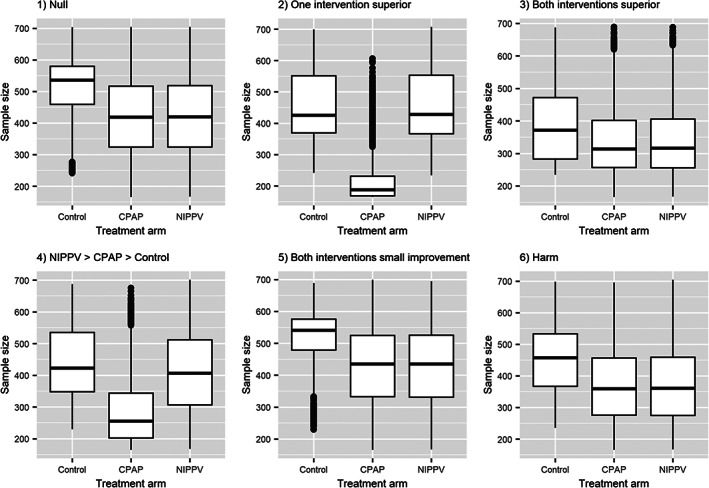
Boxplots showing the distribution of allocations (number of patients) for each treatment arm across the 10,000 simulated trials for each scenario (represented in separate plots) for the Bayesian adaptive design case study

Boxplots showing the distribution of allocations (number of patients) for each treatment arm across the 10,000 simulated trials for each scenario (represented in separate plots) for the Bayesian adaptive design case study