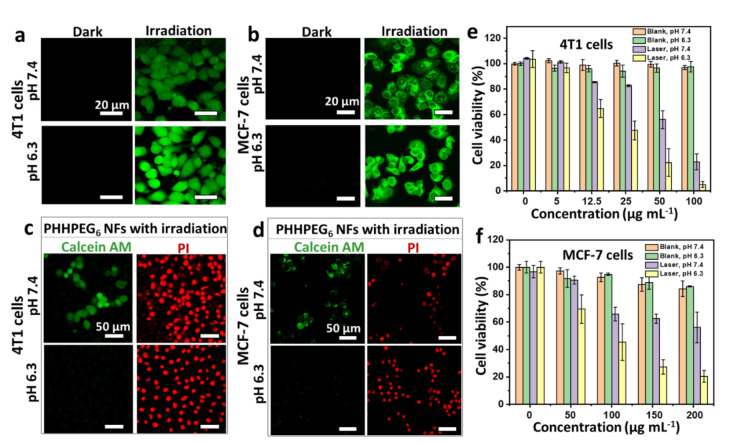
Figure 4.
CLSM images of intracellular 1O2 generation in a) 4T1 cells and b) MCF‐7 cells measured by DCFH‐DA after treatment of the cells with PHHPEG6 NFs at pH 7.4 and 6.3 with and without 660 nm laser irradiation (0.12 W cm−2, 10 min). CLSM images of c) 4T1 cells and d) MCF‐7 cells stained with calcein‐AM/PI, incubated with PHHPEG6 NFs at pH 7.4 and 6.3 with 660 nm laser irradiation (0.12 W cm−2, 10 min). The concentration of PHHPEG6 NFs used for 4T1 cells was 50 μg mL−1, and for MCF‐7 cells 200 μg mL−1 in a‐d. MTT assay of cell viability of e) 4T1 cells) and f) MCF‐7 cells with PHHPEG6 NFs at different concentrations at pH 7.4 and 6.3, with and without 660 nm laser irradiation (0.12 W cm−2, 10 min).

