FIGURE 1.

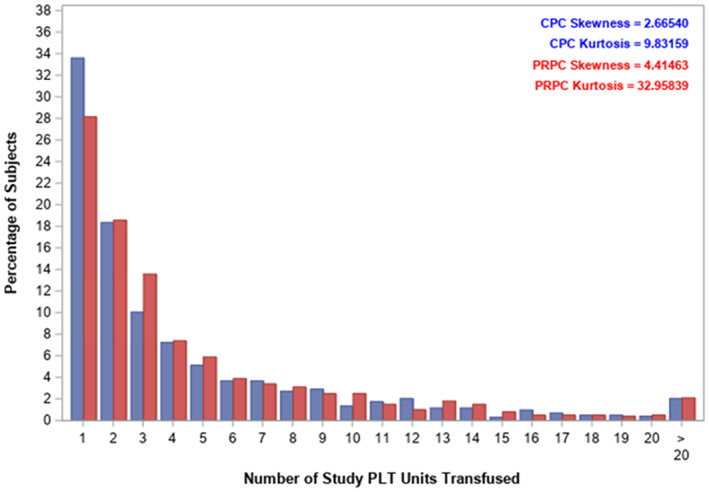
Distribution of the number of platelet components transfused for the per protocol analysis (blue— conventional PC, red—PRPC) [Color figure can be viewed at wileyonlinelibrary.com]

Distribution of the number of platelet components transfused for the per protocol analysis (blue— conventional PC, red—PRPC) [Color figure can be viewed at wileyonlinelibrary.com]