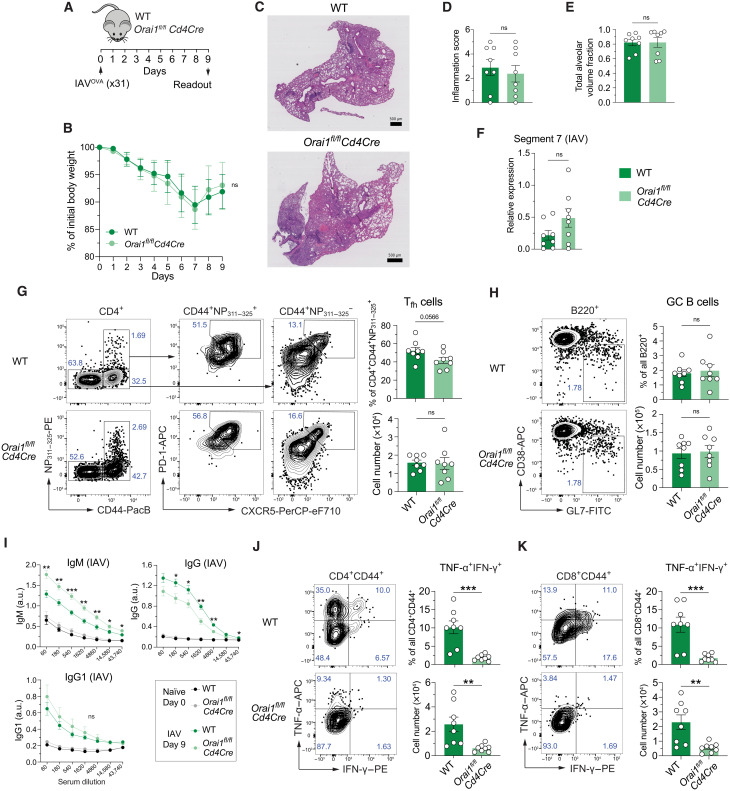
Fig. 1. Deletion of Orai1 in T cells does not attenuate pulmonary inflammation and antibody production after infection with IAV.
(A) Mouse model of x31 (H3N2) IAV infection. (B) Body weight of WT versus Orai1fl/flCd4Cre mice after infection with IAV, shown as weight normalized to day 0. (C) Representative hematoxylin and eosin (H&E) stains of lungs from WT and Orai1fl/flCd4Cre mice at day 9 after infection with x31 influenza A. Scale bar, 500 μm. (D) Inflammation score calculated from the lungs of WT and Orai1fl/flCd4Cre mice at day 9 following IAV infection. (E) Total alveolar volume fraction of lungs from WT and Orai1fl/flCd4Cre mice. (F) qRT-PCR analysis of IAV (segment 7) levels in total lung tissue from WT versus Orai1fl/flCd4Cre mice at day 9 after infection. (G) Representative flow cytometry plots of IAV-specific CXCR5+PD-1+ Tfh cells, their frequencies (%), and absolute numbers in mediastinal lymph nodes (mLNs) from WT and Orai1fl/flCd4Cre mice 9 days after IAV infection. (H) Representative flow cytometry plots of B220+CD38−GL7+ GC B cells, their frequencies (%), and absolute numbers in mLNs from WT and Orai1fl/flCd4Cre mice 9 days after IAV infection. FITC, fluorescein isothiocyanate. (I) IAV (x31)–specific IgM, IgG, and IgG1 levels in the serum of WT and Orai1fl/flCd4Cre mice before (day 0) and after (day 9) IAV infection. a.u., arbitrary units. (J and K) Analysis of TNF-α– and IFN-γ–producing CD4+CD44+ (J) and CD8+CD44+ (K) T cells from mLNs of WT and Orai1fl/flCd4Cre mice at day 9 after IAV infection. Representative flow cytometry plots, frequencies (%), and total numbers of T cells. Data in (A) to (K) are the means ± SEM of eight WT and eight Orai1fl/flCd4Cre mice and two independent experiments. Statistical analysis is performed by unpaired Student’s t test with the following significance levels: ***P < 0.001; **P < 0.01; *P < 0.05. ns, not significant.

