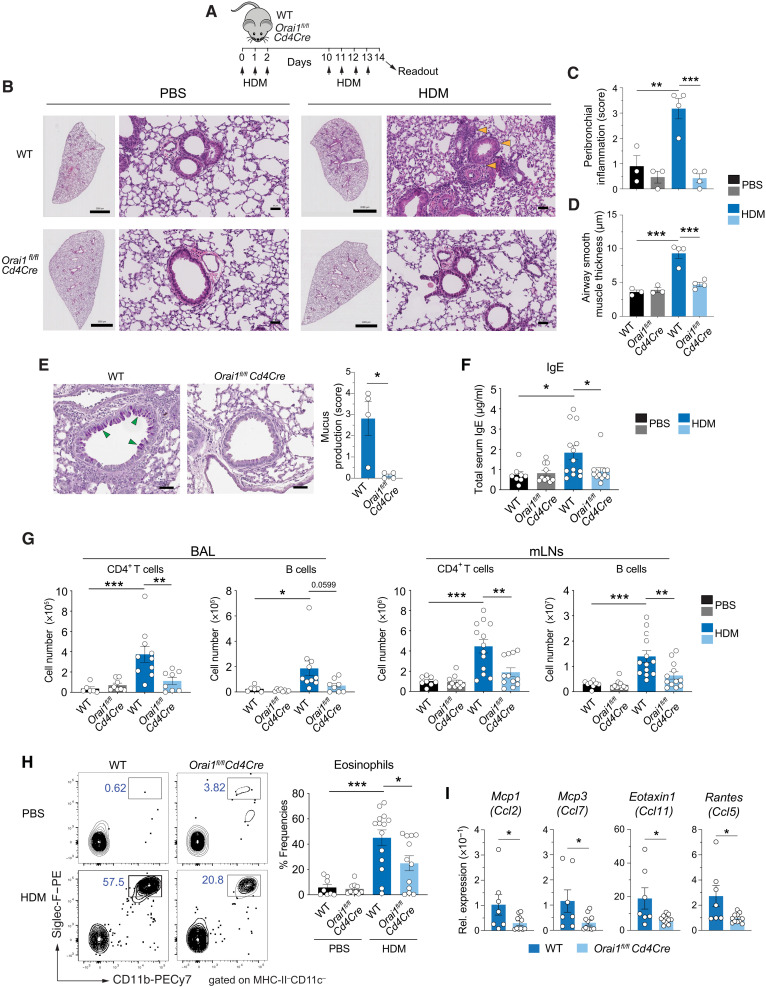
Fig. 2. ORAI1 is essential for T cell–dependent allergic airway inflammation in response to HDM exposure.
(A) Mouse model of sensitization and rechallenge of mice with HDM extract to induce allergic airway inflammation. (B) Representative H&E stains of lungs from WT and Orai1fl/flCd4Cre mice at day 14. Scale bars, 2000 μm (right) and 50 μm (left). (C and D) Analysis of peribronchial inflammation (C) and airway smooth muscle layer thickness (D) of WT and Orai1fl/flCd4Cre mice at day 14. (E) Representative PAS stains of lungs and quantitative analysis of mucus production of WT and Orai1fl/flCd4Cre mice at day 14. Scale bars, 50 μm. (F) Total IgE levels in the serum of WT and Orai1fl/flCd4Cre mice at day 14. (G) Numbers of CD4+ and B220+ B cells in the BAL fluid (left) and mLNs (right) of mice at day 14. (H) Representative flow cytometry plots and summary bar graphs showing the frequencies of Cd11b+Siglec-F+ eosinophils within MHC-II−CD11c− cells in the BAL fluid of WT and Orai1fl/flCd4Cre mice at day 14. (I) Relative mRNA expression of chemokines in whole lung tissue (qRT-PCR). Data in (C) to (E) are the means ± SEM of three to four mice per group. Data in (F) are the means ± SEM from 8 to 13 mice per cohort. Data in (G) are the means ± SEM from 6 to 13 mice per cohort. Data in (H) are the means ± SEM of 8 to 14 mice per cohort. Data in (I) are the means ± SEM of 7 to 11 mice per cohort. Data are from at least two independent experiments; statistical analysis in (C), (D), and (F) to (H) is performed by one-way analysis of variance (ANOVA) (Tukey’s multiple comparisons test) and that in (E) and (I) is performed by unpaired Student’s t test. ***P < 0.001; **P < 0.01; *P < 0.05.

