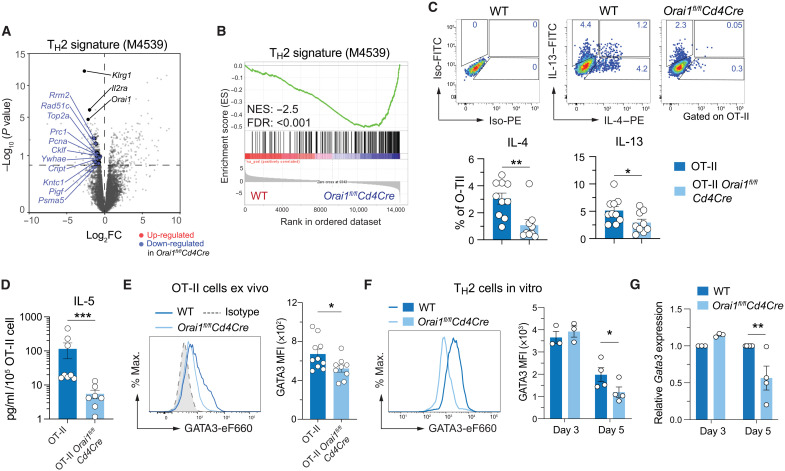
Fig. 5. ORAI1 regulates TH2 cell differentiation and function.
(A to E) Analysis of RNA-seq data from T cells of WT and Orai1fl/flCd4Cre mice at day 14 of HDM/OVA treatment (Fig. 3B). (A and B) Volcano plot (A) and GSEA plot (B) of DEGs in Orai1-deficient versus WT CD4+ T cells that belong to the gene set naïve CD4 T cell versus 48h act TH2 down (M4529) (115). FC, fold change. (C) Representative flow cytometry plots and frequencies of IL-4– and IL-13–producing WT and Orai1fl/flCd4Cre donor OT-II CD4+ T cells isolated from the lungs of TCRα−/− host mice day 14 after HDM/OVA treatment. Cells were stimulated with phorbol 12-myristate 13-acetate (PMA)/ionomycin for 4 hours in vitro. (D) IL-5 production by donor OT-II T cells isolated from the lungs of TCRα−/− host mice at day 14 after HDM/OVA treatment and restimulated in vitro with anti-CD3 for 24 hours. IL-5 concentration was measured in the cell culture supernatants by cytometric bead array and normalized to T cell numbers. (E) Representative flow cytometry plots and quantification of GATA3 mean fluorescence intensity (MFI) in OT-II cells isolated from lungs of mice at day 14 after HDM/OVA treatment. (F and G) GATA3 expression by CD4+ T cells polarized into TH2 cells for 3 to 5 days in vitro. GATA3 protein (F) and mRNA (G) expression measured by flow cytometry and qRT-PCR, respectively. mRNA levels were normalized to Rpl32 housekeeping gene and WT T cells. Data in (C) to (E) are the means ± SEM of 9 to 10 mice from two independent experiments. Data in (F) and (G) are the means ± SEM of three to four mice from at least two independent experiments. Statistical analysis in (C) is performed by unpaired Student’s t test; that in (D) and (E) is performed by Mann-Whitney test; that in (F) is performed by paired Student’s t test; and that in (G) is performed by two-way ANOVA (Sidak’s multiple comparison). ***P < 0.001; **P < 0.01; *P < 0.05.

