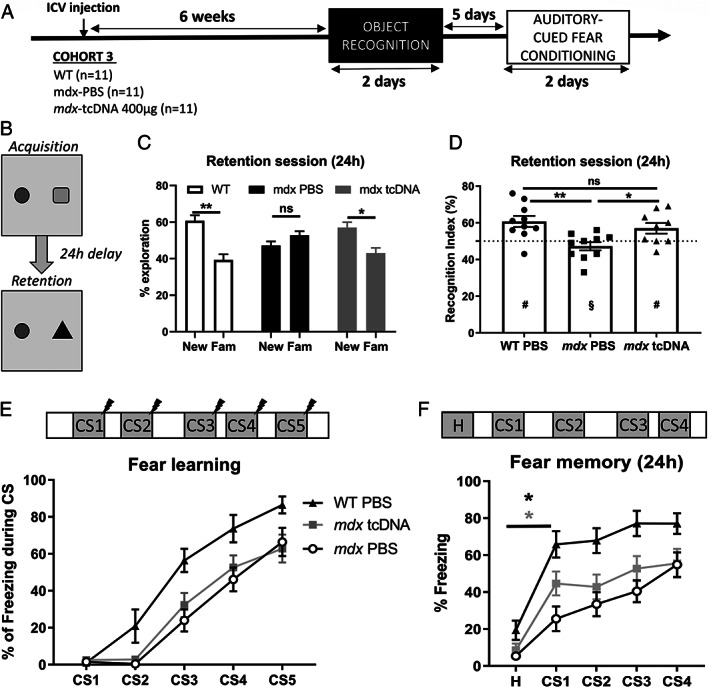
FIGURE 6.

Impact of brain dystrophin restoration on cognition. (A) Schematic representation of the study design applied to the third cohort of mice (Cohort 3), showing the sample sizes, the intracerebroventricular (ICV) injection, the post‐injection delay at which behavioral testing started (6 weeks), which comprised an object recognition test followed by the auditory‐cued fear conditioning with an interval of 5 days between the two tests. (B–D) Object recognition test performed 6 weeks after ICV injection of 400 μg tricyclo‐DNA antisense oligonucleotide (tcDNA‐ASO) or phosphate‐buffered saline (PBS) in mdx mice (n = 9 per group) and of PBS in wild‐type (WT) littermate mice (n = 10). (B) Schematic representation of the object recognition composed of an acquisition session with two different objects, followed 24 hours later by a retention session during which one of the object is replaced by a novel object. (C) Relative time spent (%) exploring the new and familiar (Fam) objects during the retention session, calculated as the time spent exploring one of these objects divided by the total exploration time × 100. (D) Recognition index calculated as the time spent exploring the new object, divided by the total exploration time × 100. The horizontal dotted line represents chance level (50%). Values are means ± SEM. # p < 0.05 significantly different from the 50% chance level, and § p > 0.05 not different from 50%; *p < 0.05, **p < 0.01 significantly different from mdx PBS; ns: no significant difference between mdx tcDNA and WT groups. (E, F) Auditory‐cued fear conditioning performed 7 weeks after the ICV injection of 400 μg of tcDNA‐ASO or PBS in mdx mice (n = 9 per group) and WT littermate mice (n = 10). (E) The top drawing shows the succession of CS‐US pairs of stimuli (30‐second tone followed by electric shock) spaced by variable delays between pairs of stimuli during the acquisition session. The plot shows the fear‐learning performance during the acquisition session, expressed as percentage of freezing during the five 30‐second tones (CS1‐5). (F) Fear memory assessed during the retention session performed 24 hours later in a new context. The top drawing shows the succession of baseline habituation period (H) and CS1 to CS4 delivered alone (30‐second tones, no shock), spaced by variable delays. The plot shows the learning performance expressed as the percentage of time spent freezing during baseline habituation (H) and the presentation of the four conditioned stimulus (CS1–4). Group differences were significant in both sessions (group effects: p < 0.0001; two‐way ANOVAs for repeated measures), *(black star) WT group H versus CS1 p = 0.0032; *(grey star) mdx‐tcDNA treated mice H versus CS1 p = 0.0001.
