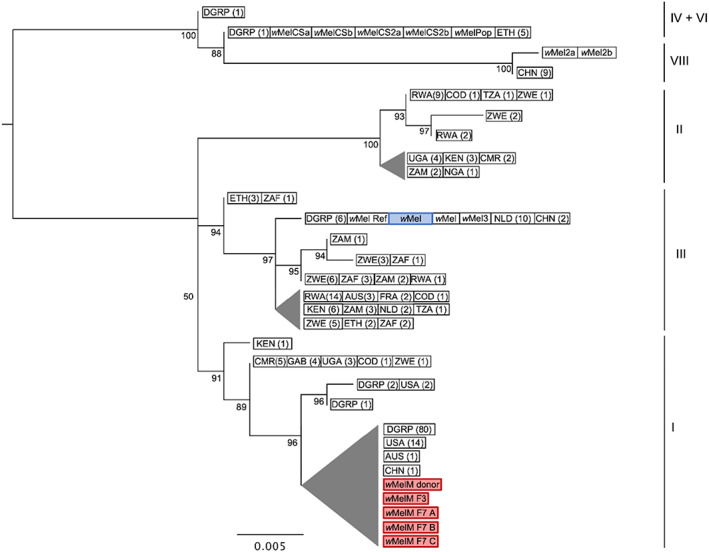
Fig. 1.

Genome‐wide SNP phylogenetic analysis of wMel variants. SNP data from the six genomes in this study and 253 previously published wMel genomes were analysed (Richardson et al., 2012; Chrostek et al., 2013; Early and Clark, 2013). The wMel variant highlighted in blue is the original wMel transinfection (Walker et al., 2011) used in phenotypic comparisons with wMelM. wMelM sequences are highlighted in red. Maximum likelihood trees were constructed with RAxML‐HPC using 58 SNP loci and ascertainment bias correction; scale bar = number of substitutions per SNP matrix site. Nodes with bootstrap values less than 50% have been collapsed; triangle height = length of longest branch within node. Wolbachia wMel clades are shown on the right. In cases where multiple samples had identical SNP haplotypes, one representative sequence was used for tree construction. The number of sequences corresponding to each entry is shown in parentheses. For wild populations, the location of sampling is shown (refer to Table S1 for sample names). AUS = Australia; CHN = China; CMR = Cameroon; COD = Democratic Republic of the Congo; ETH = Ethiopia; FRA = France; GAB = Gabon; GIN = Guinea; KEN = Kenya; NGA = Nigeria; NLD = Netherlands; RWA = Rwanda; TZA = Tanzania; UGA = Uganda; USA = USA; ZAF = South Africa; ZMB = Zambia; ZWE = Zimbabwe; DGRP = Drosophila Genetic Reference Panel (originally sampled from Raleigh NC, USA).
