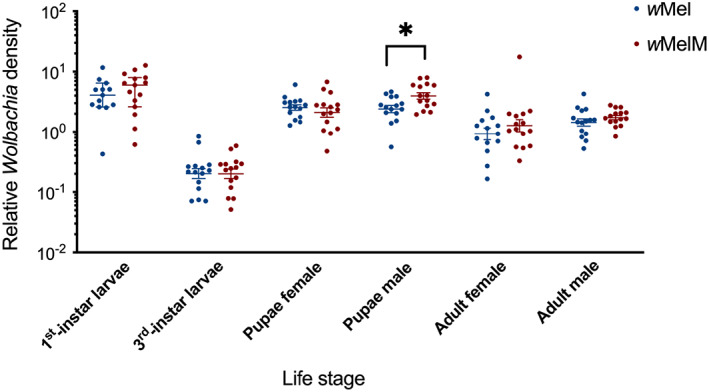
Fig. 4.

Wolbachia density of different life stages in backcrossed wMel and wMelM Aedes aegypti populations. Each point represents the relative density for an individual averaged across two to three technical replicates. We measured fifteen individuals from each life stage, sex and wMel variant. We used mRpS6 as the reference gene to calculate relative density. Medians and 95% confidence intervals are shown in lines and error bars.
