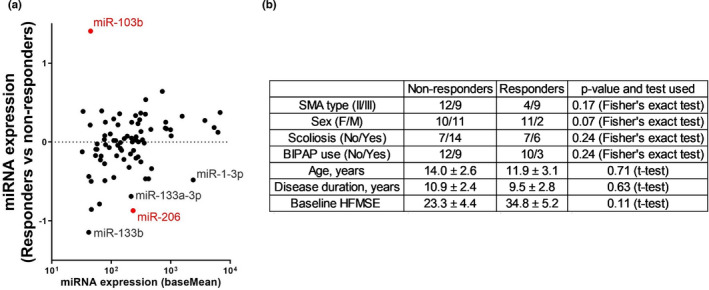
FIGURE 2.

Pre‐treatment miRNA signature predicts the response to nusinersen treatment. (a) MA plot of differential miRNA expression in responders (n = 13, patients with Hammersmith Functional Motor Scale Expanded [HFMSE] change ≥ 3 after 6 months of treatment) versus non‐responders (n = 21, HFMSE change ≤ 0). Data from an additional 11 patients with HFMSE change of a single or two units [1,2] were excluded. Log 2 transformed fold change (y‐axis) is shown against mean miRNA abundance (x‐axis). Red indicates significantly changed miRNAs (p < 0.05, Wald test). Higher miR‐103b levels and lower muscle enriched miRNA miR‐1‐3p, miR‐133a/b, and miR‐206 levels are observed in prospective nusinersen responders. (b) A summary of the clinical data in non‐responders and responders, showing that they are not significantly different between the groups. Numerical data are presented as mean ± SEM. Categorical data were analyzed for significant differences in sex, type, scoliosis, and bilevel positive airway pressure (BIPAP) use distribution by Fisher exact test, whereas continuous data were analyzed for differences by Student t‐test. Notably, baseline HFMSE did not significantly differ between nonresponders and responders (p = 0.11). F, female; M, male; SMA, spinal muscular atrophy [Colour figure can be viewed at wileyonlinelibrary.com]
