FIGURE 3.

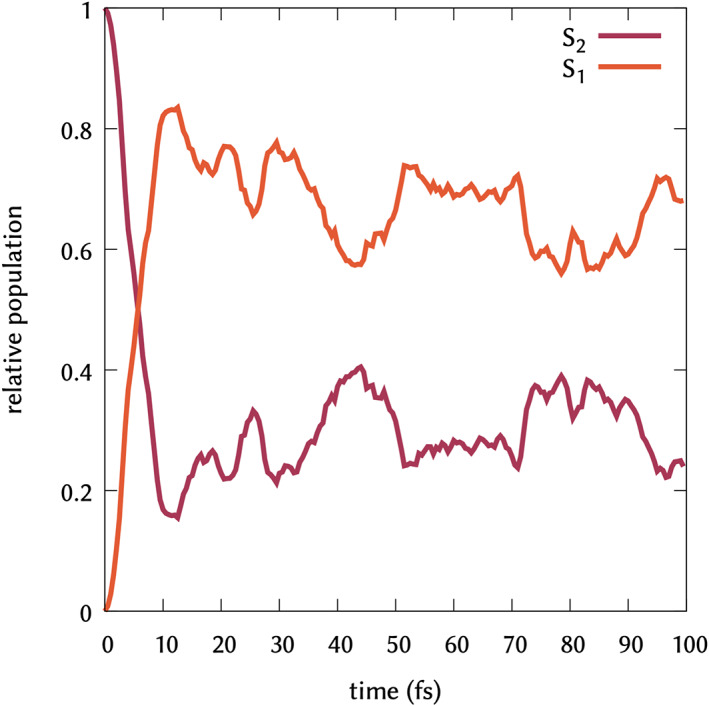
Relative population profile for S 2 (red line) and S 1 (orange line) states averaged over the 150 propagated trajectories

Relative population profile for S 2 (red line) and S 1 (orange line) states averaged over the 150 propagated trajectories