
Figure 3.
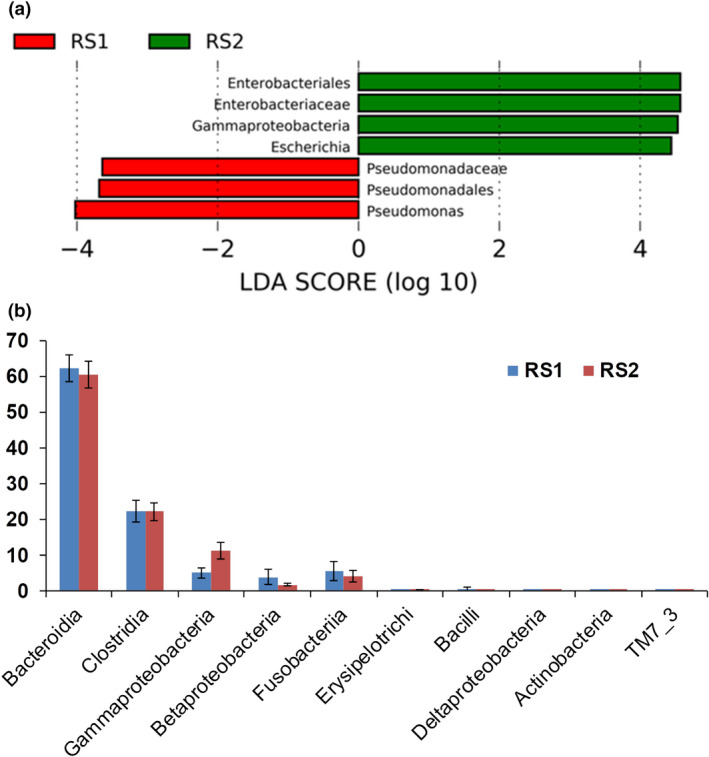
Species difference analysis. (a) LDA diagram of LEfSe analysis; the absolute value of LDA was set at 2·0. The red histogram represents RS1 group, and green histogram represents RS2 group. The length of the histogram represents LDA score, which is the significant difference between different groups. (b) Comparison of key class differences. Top ten classes with an average relative abundance of each group and the significance of difference was displayed. Data were expressed by Mean ± SEM. One‐way ANOVA test showed Grammaproteobcateria was significantly different between the two groups (P < 0·05).