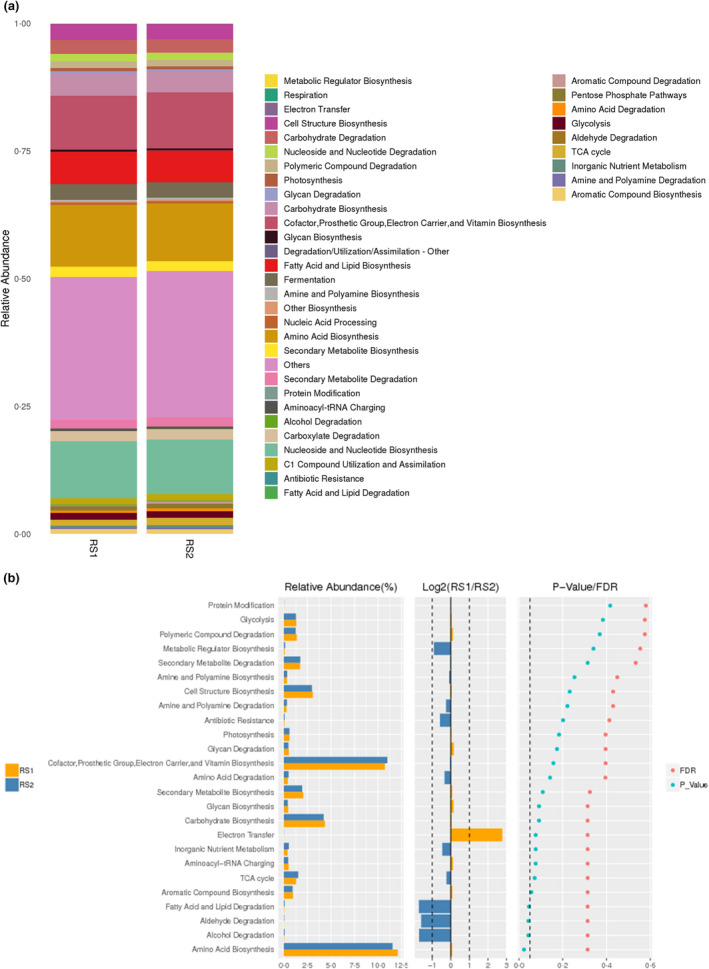
Figure 4.

The prediction of function. (a) MetaCyc classification; the Metacyc pathway in bacterial community were obtained by PICRUST 2. (b) Functional difference analysis. The left histogram showed relative abundance of species in each pathway, the middle represents the log2 value of the average relative abundance ratio of the same species in the two groups, and the right figure shows the P value and FDR values obtained by Wilcox test.
