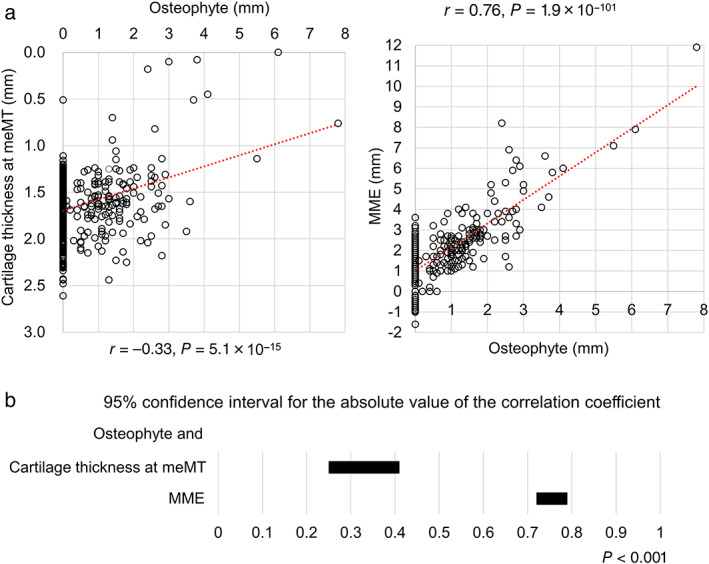
FIGURE 4.

Correlation between the osteophyte width and cartilage thickness and between the osteophyte width and MME distance. (a) Scatterplots between osteophyte thickness and cartilage thickness at the meMT subregion and between the osteophyte width and MME distance. The correlation coefficient (r) and P values are shown. (b) 95% confidence interval for the absolute value of the correlation coefficient. meMT, middle external medial tibial; MME, medial meniscus extrusion.
