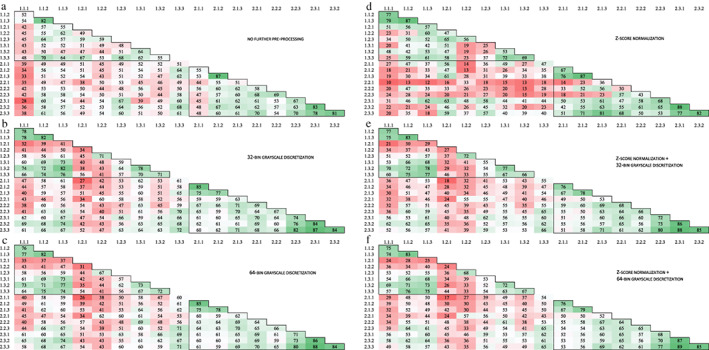
FIGURE 3.

Number of pairwise concordant radiomic features using a concordance correlation coefficient > 0.90 for T1‐weighted images with (a) no further preprocessing, (b) 32‐bin grayscale discretization, (c) 64‐bin grayscale discretization, (d) z‐score normalization, (e) z‐score normalization +32‐bin grayscale discretization, and (f) z‐score normalization +64‐bin grayscale discretization. The black frame in the top left corner shows the MRI exams taken during the first scan date and the black frame in the bottom right corner shows the MRI exams taken during the second scan date. The numbers on the axis refer to the different MRI exams scanned, wherein the first number corresponds to the scan date and the second number to the test–retest strategy. In each test–retest strategy, three scans were examined which is represented by the last number. A total of 91 radiomic features was examined.
