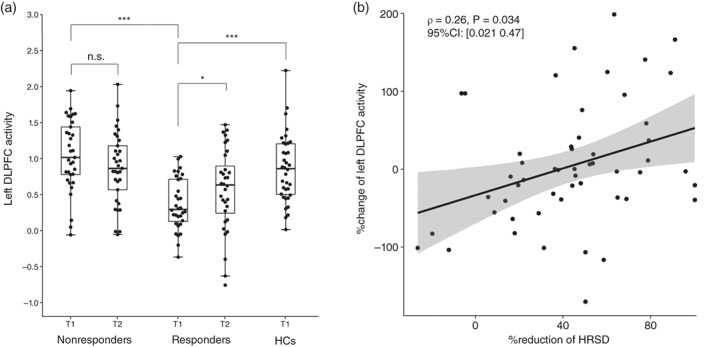
Fig. 2.

Left dorsolateral prefrontal cortex (DLPFC) activity at baseline, and their treatment changes. (a) Boxplots and beeswarm plots of the mean fractional amplitude of low‐frequency fluctuation values of the left DLPFC region of interest for each group. Responders had significantly lower left DLPFC activity than Nonresponders (Z = 5.29, adjusted P < 0.001, r = 0.66) and healthy control (HC) subjects (Z = −3.91, adjusted P < 0.001, r = 0.47). On the other hand, a comparison of baseline (T1) and post‐treatment (T2) activity showed a significant increase in left DLPFC activity in Responders (V = 150, 95% CI: [−0.43–0.016], P = 0.032) but no significant change in Nonresponders. n.s. P > 0.05, *P < 0.05, ***P < 0.001. (b) Percentage change of left DLPFC activity showed a significant positive correlation with the percentage reduction of the Hamilton Rating Scale for Depression (HRSD) score.
