
Figure 1.
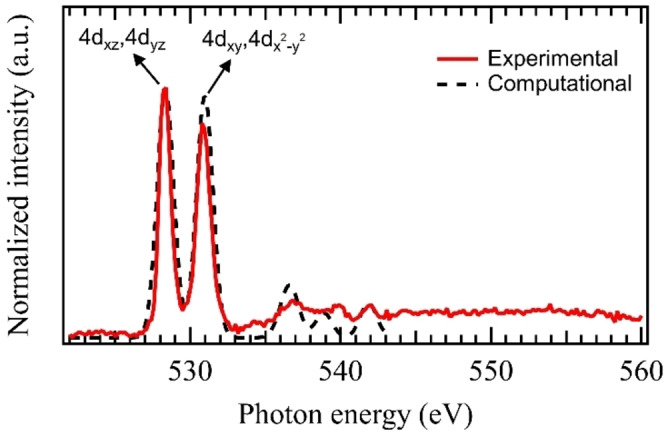
Experimental ion yield spectrum (solid red line) and computational TD‐DFT X‐ray absorption spectrum for the ground state (dashed black line) of , at the oxygen K‐edge, with very good agreement for the transitions below 542 eV.
Official websites use .gov
A
.gov website belongs to an official
government organization in the United States.
Secure .gov websites use HTTPS
A lock (
) or https:// means you've safely
connected to the .gov website. Share sensitive
information only on official, secure websites.
Experimental ion yield spectrum (solid red line) and computational TD‐DFT X‐ray absorption spectrum for the ground state (dashed black line) of , at the oxygen K‐edge, with very good agreement for the transitions below 542 eV.