Figure 1.

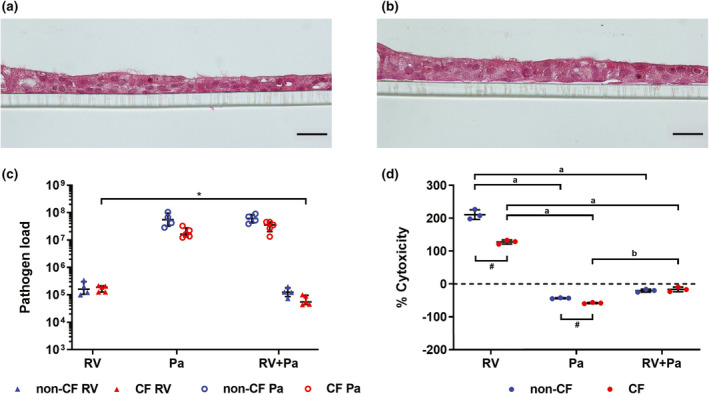
Pathogen load and cytotoxicity following infection. Hematoxylin and eosin staining representative of (a) non‐CF and (b) CF air–liquid interface cultures show formation of a ciliated epithelial layer (scale bar = 20 µm). (c) Titers of rhinovirus (RV) and adherent Pseudomonas aeruginosa calculated as plaque‐forming units and colony‐forming units, relative to RV 5′ untranslated region and P. aeruginosa 16S ribosomal RNA expression, respectively. (*P < 0.05 compared with co‐infection titer, t‐test). (d) Results from lactate dehydrogenase assay, shown as % cytotoxicity of infection conditions normalized to uninfected controls (0% cytotoxicity) (a P < 0.001 compared with P. aeruginosa and RV + P. aeruginosa infection, b P < 0.001 compared with RV + P. aeruginosa infection, one‐way ANOVA; # P < 0.01 non‐CF vs. CF, t‐test). Error bars indicate mean ± standard deviation. CF, cystic fibrosis; Pa, Pseudomonas aeruginosa.
