
Figure 2.
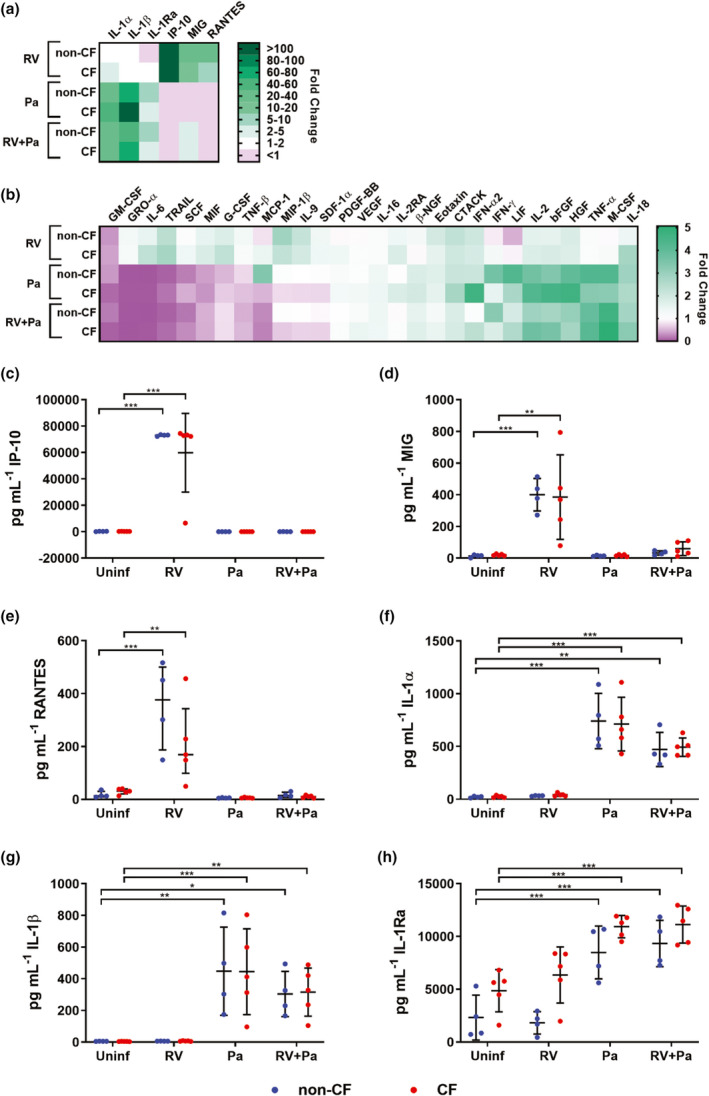
Pseudomonas aeruginosa elicits proinflammatory epithelial signals. Heat maps show median‐fold change (FC) of cytokine concentrations in washes of infected air–liquid interface cultures over washes of uninfected cultures. (a) Cytokines with > 5 FC. (b) Cytokines with ≤ 5 FC. (c) IP‐10, (d) MIG and (e) RANTES increased in response to exclusive rhinovirus (RV) infection and (f) IL‐1α, (g) IL‐1β and (h) IL‐1Ra increased in response to P. aeruginosa and viral–bacterial co‐infection [*P < 0.05, **P < 0.01, ***P < 0.001 compared with uninfected controls, repeated measures (RM) one‐way ANOVA]. Error bars indicate mean ± standard deviation. Data points indicate cytokine concentrations in washes of individual primary cell cultures. CF, cystic fibrosis; IL, interferon gamma‐induced protein 10; interleukin; IP‐10, MIG, monokine induced by gamma interferon; Pa, Pseudomonas aeruginosa; RANTES, regulated on activation, normal T cell expressed and secreted.