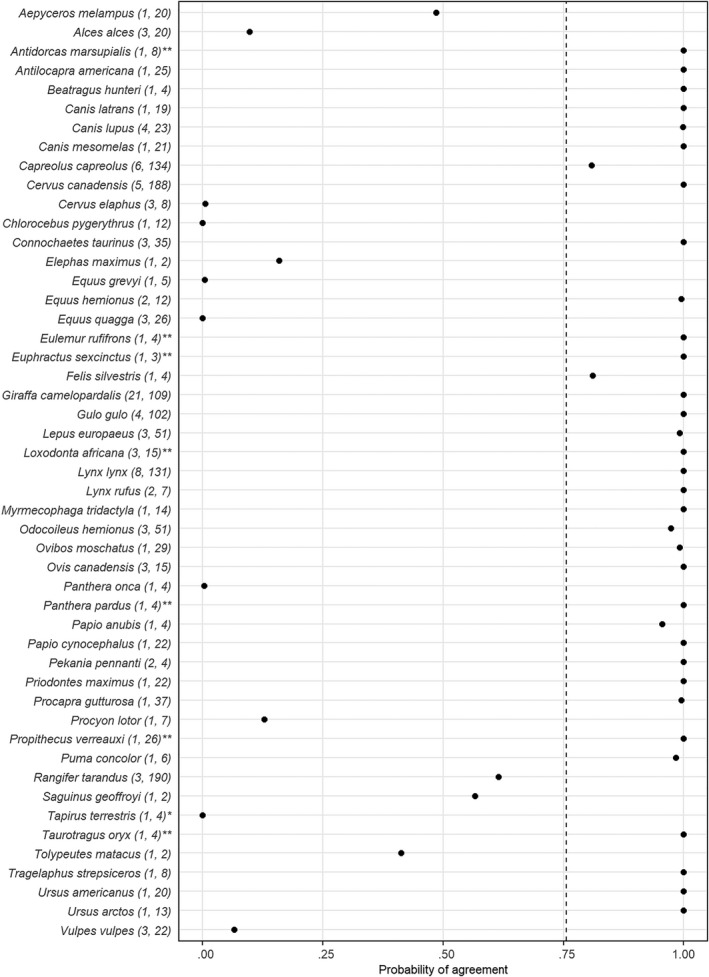
FIGURE 2.

Probability of agreement between the International Union for Conservation of Nature (IUCN) habitat suitability data and the proportional habitat use estimates for each species. The dashed line indicates the average probability of agreement across all species. The numbers in parentheses indicate the number of populations and number of individuals for the species, respectively. * indicates species for which all individuals only occurred in unsuitable habitat types. ** indicates species for which all individuals only occurred in suitable habitat types
