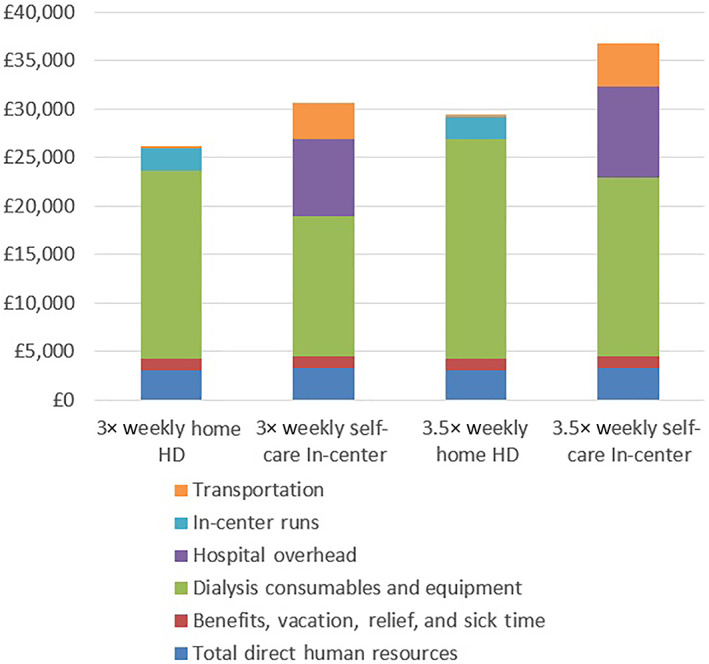
FIGURE 1.

Overview of component costs by location and frequency of dialysis treatment [Color figure can be viewed at wileyonlinelibrary.com]

Overview of component costs by location and frequency of dialysis treatment [Color figure can be viewed at wileyonlinelibrary.com]