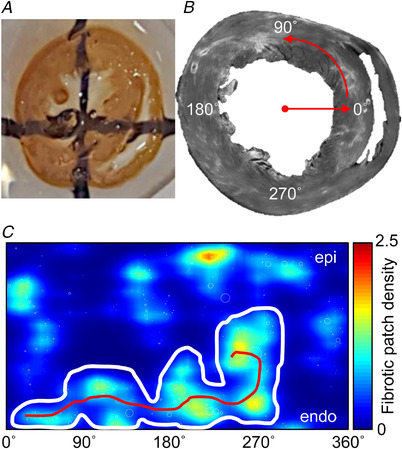
Figure 1. Tissue imaging and analysis.

A, short axis ventricular ring (2–3 mm thick) optically cleared using methyl salicylate. Lines on the surface below indicate translucency. B, composite image of WGA fluorescence in upper surface of ventricular ring acquired using a confocal microscope (6.22 × 6.22 μm2 pixels). C, patches of fibrosis from B mapped in polar coordinates and represented as a continuous distribution map. The white envelope bounds a region of aggregated fibrosis patch and the length of the skeletonization (red line) reflects the tortuosity of the region. [Colour figure can be viewed at wileyonlinelibrary.com]
