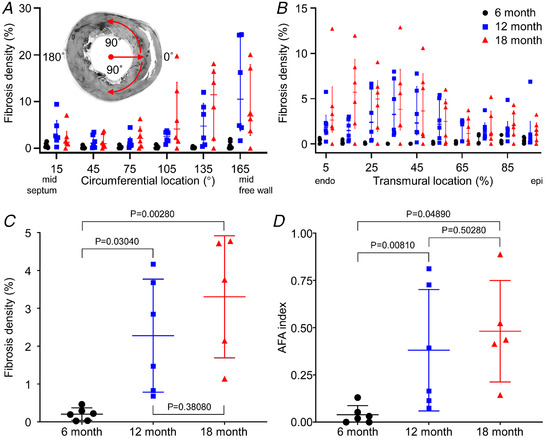
Figure 2. LV fibrosis distribution for 6 (n = 6), 12 (n = 6) and 18 (n = 5) months age groups.

A, circumferential distributions of LV fibrosis density from mid septum to mid free wall. Data from ± angles are binned from 15° to 165°. Median and quartiles are also shown. B, transmural distributions of fibrosis density. Median and quartiles are also shown. C, fibrosis density varying with age cohort. One‐way ANOVA and post hoc Tukey test were used to calculate P‐values. D, aggregated fibrosis patch density area (AFA) index at 6, 12 and 18 months. One‐way ANOVA and post hoc Tukey test were used to calculate P‐values. [Colour figure can be viewed at wileyonlinelibrary.com]
