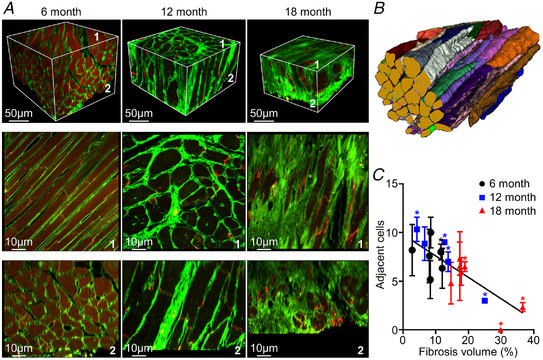
Figure 3. Changes in LV mid wall 3D microstructure.

A, representative images from cleared tissue specimens from anterior LV mid wall labelled with WGA (green) at 6, 12 and 18 months. The dull red at 6 months is due to background auto‐fluorescence. The upper panel presents volume‐rendered 3D images, while the lower panels show mid‐block longitudinal and cross‐sectional image planes parallel to surfaces 1 and 2. B, segmented myocytes from 6 month SHR. C, connected adjacent cells as a function of 3D fibrosis density. Data for n = 39, 15 and 28 selected cells are presented as means ± SD at 6, 12 and 18 months, respectively. *Three selected myocytes. For best‐fit regression line shown, R 2 = 0.692 and P = 0.00060 (linear regression, F‐statistic). [Colour figure can be viewed at wileyonlinelibrary.com]
