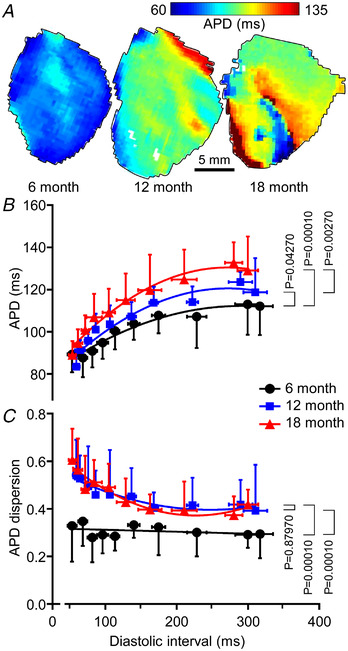
Figure 5. Variation of epicardial action potential duration (APD) with diastolic interval (DI).

A, representative APD maps for 6, 12 and 18 months at a base cycle length of 140 ms. B, APD as a function of DI for the three age cohorts at 6 months (45 measurements from five animals), 12 months (45 measurements from five animals) and 18 months (46 measurements from five animals). Two‐way ANOVA and post hoc Tukey test were used to calculate P‐values. C, APD dispersion as functions of DI at 6 months (45 measurements from five animals), 12 months (45 measurements from five animals) and 18 months (46 measurements from five animals). Two‐way ANOVA and post hoc Tukey test were used to calculate P‐values. [Colour figure can be viewed at wileyonlinelibrary.com]
