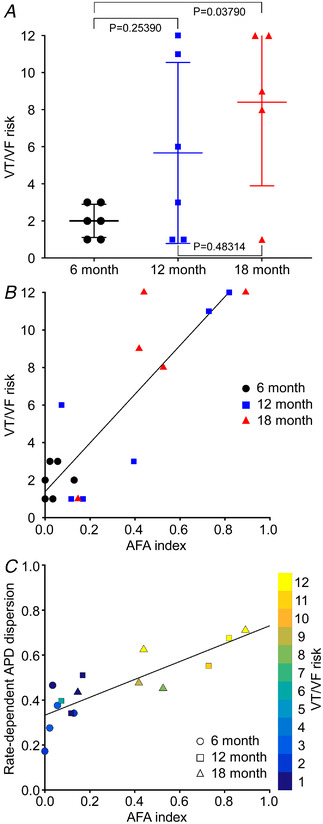
Figure 6. VT/VF risk, structural remodelling and rate‐dependent APD dispersion.

A, VT/VF risk at 6, 12 and 18 months (n = 6, 6 and 5, respectively). One‐way ANOVA and post hoc Tukey test were used to calculate P‐values. B, VT/VF risk as a function of aggregated fibrosis patch density area (AFA) index. For best‐fit regression line shown, R 2 = 0.76, P = 0.00487 × 10⁻³, linear regression, F‐statistic. n = 17. C, VT/VF risk as a function of rate‐dependent APD dispersion and AFA index. For best‐fit regression line shown, R 2 = 0.70 and P = 0.00103 × 10⁻¹, linear regression, F‐statistic. n = 15. [Colour figure can be viewed at wileyonlinelibrary.com]
