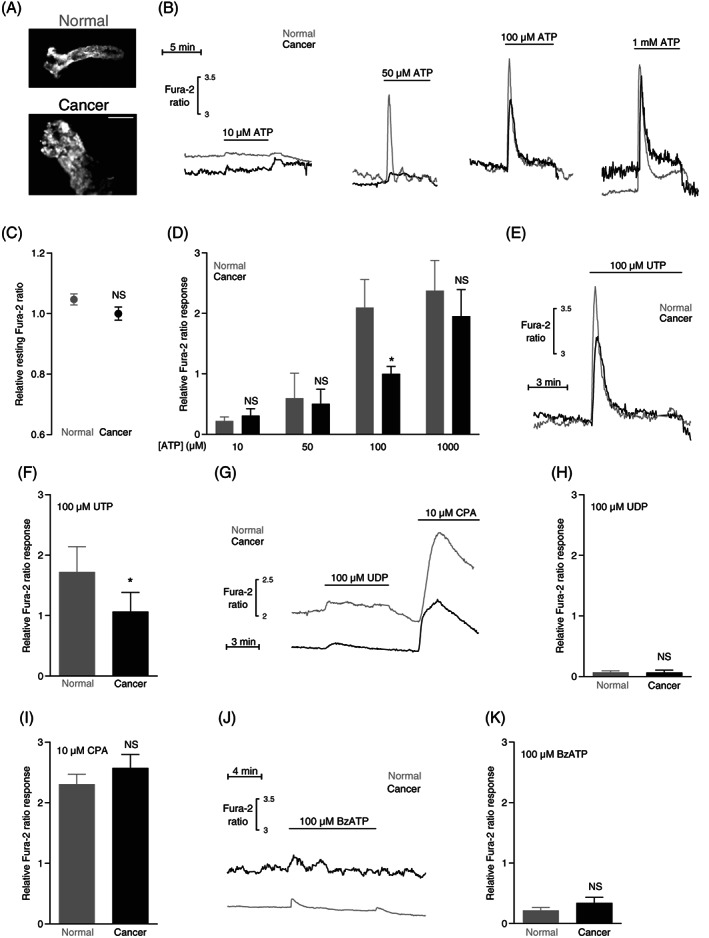
FIGURE 3.

Intracellular Ca2+ responses to ATP and UTP are attenuated in human colon cancer tissue compared with normal colon tissue. (A) Images of Fura‐2‐loaded crypt‐like structures from normal colon tissue (upper panel) and colon cancer tissue (lower panel). The images are shown at the same magnification; the scale bar represents 100 μm. (B) Original traces showing ATP‐induced intracellular Ca2+ dynamics in crypts from colon cancer and normal colon tissue. (C) Average baseline intracellular Ca2+ levels in crypts from colon cancer and normal colon tissue (n = 38). The Ca2+ levels are expressed relative to the average value for the colon cancer tissue. (D) Average intracellular Ca2+ responses to ATP in crypts from colon cancer and normal colon tissue (n = 6‐21). (E) Original traces showing UTP‐induced intracellular Ca2+ dynamics in crypts from colon cancer and normal colon tissue. (F) Average intracellular Ca2+ responses to UTP in crypts from colon cancer and normal colon tissue (n = 14). (G) Original traces showing UDP‐ and cyclopiazonic acid (CPA)‐induced intracellular Ca2+ dynamics in crypts from colon cancer and normal colon tissue. (H + I) Average intracellular Ca2+ responses to UDP (H, n = 4) or CPA (I, n = 38) in crypts from colon cancer and normal colon tissue. (J) Original traces showing benzoylbenzoyl (Bz)ATP‐induced intracellular Ca2+ dynamics in crypts from colon cancer and normal colon tissue. (K) Average intracellular Ca2+ responses to BzATP in crypts from colon cancer and normal colon tissue (n = 5). The data in panel C, F, H and I were compared by paired two‐tailed Student's t test. In panel D, data were compared by repeated measures two‐way ANOVA followed by Sidak's posttest. *P < .05, NS: not significantly different vs normal under similar conditions. The Ca2+ responses are expressed relative to the average response of colon cancer crypts exposed to 100 μM ATP
