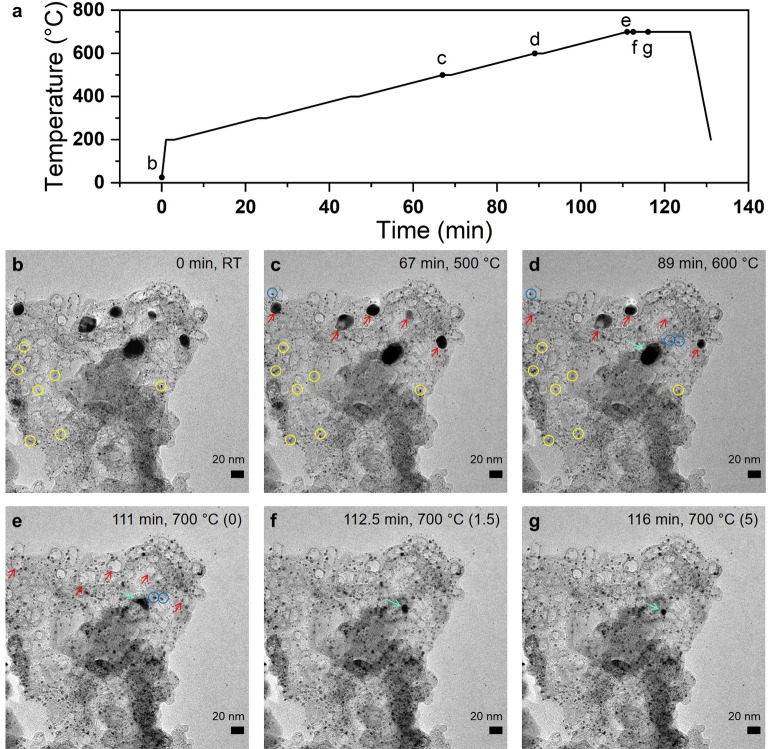
Figure 3.
Investigation of the evolution from Pt to PtNi alloy using an in situ heating TEM technique. In situ TEM imaging of the pristine hybrid Pt/NiNC catalyst during heating from 25 °C (RT) to 700 °C under vacuum condition. a) Temperature profile over time with marked points corresponding to the images in panels (b–g). Starting from 200 °C, temperature was increased in step of 100 °C (5 K/min). The specimen was annealed for 2 min at each step below 700 °C and 15 min at final 700 °C. Yellow circles in panels (b–d) mark the Pt NPs agglomerated. Red arrows in panels (c–e) mark the evolution of Ni NPs. Light green arrows in panels (d–g) mark the same Ni NPs. In panels (e–g), the numbers in parentheses indicate the holding time in minutes at 700 °C.

