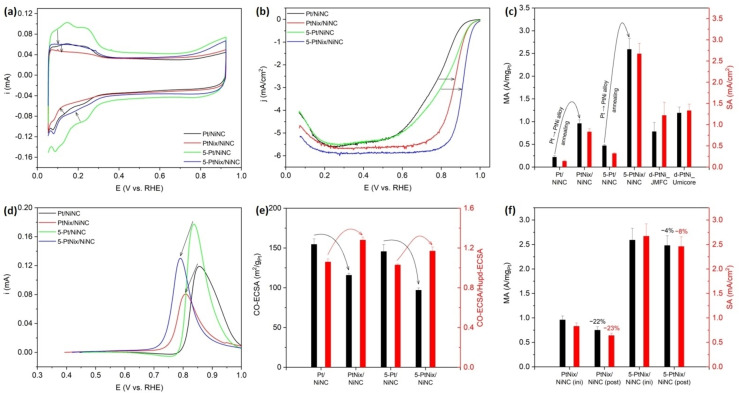
Figure 5.
RDE electrochemical measurements on Pt/NiNC‐based catalyst samples with two dealloyed PtNi alloy benchmark catalysts. a) Cyclic voltammetry (CV) curves of pristine Pt/NiNC and annealed PtNi/NiNC catalyst samples. Black arrows indicate the decrease of Hupd regions. b) ORR polarization curves. Black arrows indicate the right shift of half‐wave potential. c) Comparison of mass activities (MA) and specific activities (SA) measured at 0.9 VRHE. d) Background‐subtracted CO stripping voltammetry curves. Black arrows indicate the cathodic shift of the CO oxidation peak after annealing treatment. e) CO‐ECSA values estimated from CO stripping method and the ratios of CO‐ECSA versus Hupd‐ECSA. Black curved arrows indicate the decrease of CO‐ECSA values, whereas red ones indicate the increase of the ratio of CO‐ECSA/Hupd‐ECSA. f) Comparison of MA and SA before and after the accelerated durability test (ADT), which is 10 000 CV cycles between 0.6 and 0.925 VRHE at 100 mV s−1. Geometric Pt mass loading: 1.9 μg cm−2 for Pt/NiNC, 1.9 μg cm−2 for PtNi/NiNC, 3.2 μg cm−2 for 5‐Pt/NiNC, 3.2 μg cm−2 for 5‐PtNi/NiNC, 14.7 μg cm−2 for d‐PtNi_JMFC, and 14.9 μg cm−2 for d‐PtNi_Umicore.

