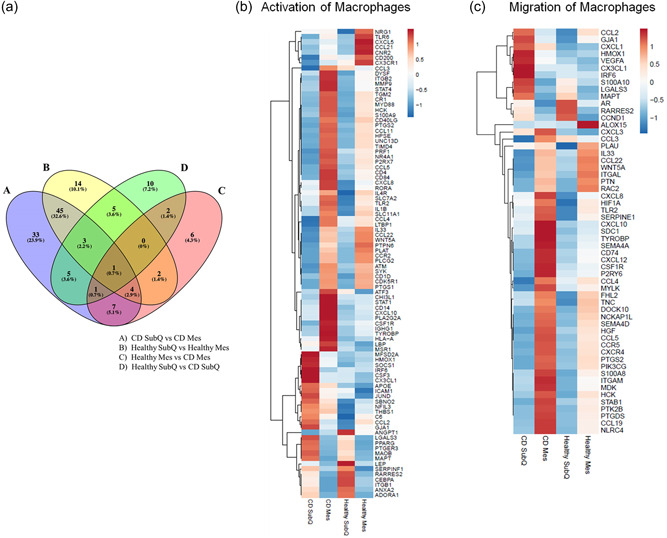
Figure 1.

Adipose tissues' macrophage gene expression. (A) Venn diagram of significant differentially expressed genes related to macrophages. (B) Normalized FPKM z‐score heat map of significant differentially expressed genes related to the activation of macrophages in CD SubQ, CD Mes, Healthy SubQ, and Healthy Mes samples. (C) Normalized FPKM z‐score heat map of significant differentially expressed genes related to the migration of macrophages in CD SubQ, CD Mes, Healthy SubQ, and Healthy Mes samples. CD, Crohn's disease; FPKM, fragments per kilobase of exon per million fragments mapped.
