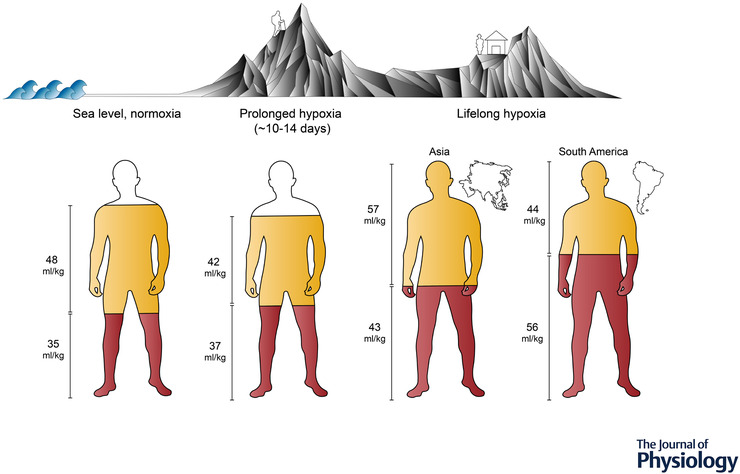
Figure 3. Comparison of total blood volume and its components.

Comparison of total blood volume and its components amongst lowlander populations at sea level (left) and with prolonged hypoxia (middle), as well as populations residing at high altitude (right). Total fill indicates the relative proportions (i.e. scaled to body mass, ml/kg) of total blood volume, whereas red and yellow fills represent the relative red cell volume and plasma volume, respectively (representative data from Stembridge, Williams et al., 2019. In the earlier stage of prolonged hypoxia (∼10–14 days), lowlanders initially experience plasma volume constriction, whereas the red cell volume generally remains unchanged, resulting in an increased haemoglobin concentration. As duration exposure increases from weeks to months, blood volume is gradually restored via erythrocytosis (Pugh, 1964; Reynafarje et al., 1959). Compared to lowlanders, high‐dwelling populations have substantially larger blood volumes for their body size; however, Andean individuals often present with much higher proportions of red cell volumes, whereas Sherpa have haemoglobin concentrations comparable to those seen in acclimatized lowlanders (Stembridge, Williams et al., 2019).
